Section 4. Supply Planning Module: Program Data
As previously defined on Important QAT Concepts and Terms, a program is similar in structure to a PipeLine supply plan database. Each program consists of only one country, one or more technical area(s), one region (national level, central level, etc.), and one organization (MOH, PEPFAR-only, PMI-only). Every program within a realm is governed by the same standardized master data, such as product catalog, procurement agents, funding sources, data sources, etc.
Program data management sits on the third tier of the QAT system hierarchy and is generally done by users with the roles program admin and program user (for more information on the user roles, please see Annex 3: User Role Matrix). Program-level master data managed by these users include budgets and alternate reporting units.
A user can “Download” or “Delete” programs from their local machine. Programs can also be “Imported” to the local machine or “Exported” from the local machine to share with other users if there are connectivity issues.
Program admins and users can manipulate two big categories of data within their programs: Program data and Transactional data (the “big 3” – consumption, inventory, shipments).
| Data Category | Details |
|---|---|
| Program Info | Program Manager, Freight %, Lead Times |
| Background Data Product Info | Planning units – min, reorder interval, alternate reporting units |
| Budget | Funding source, amounts, beginning and ending dates, etc. |
| Transactional Data (“Big 3”) | Consumption: Forecasted consumption and actual consumption, as it becomes available. Stock for each product: Shipments, Inventory counts & Adjustments (Quantities, receive date, status, procurement agent, funder & associated budget, (if available) batch #s & expiry dates). |
Table 7: Program level data
4.A. Background Data
[!NOTE] All background data must be updated while a user is online. It is recommended that users click “master data sync” after making any background data updates so it is reflected throughout the tool.
4.A.1. Program Information
Program managers in QAT can define their general program parameters, by selecting from a list of dropdowns that contain realm-level master data for each the fields. These general parameters for the supply planning module include program name, program manager, default freight percentages for air, sea, & road freight, lead times by shipment status, and notes. General parameters for the forecasting module include program name, program manager, and notes. Program users will be able to list/view all the programs they have access to, while only Program Admins are able to update any of the program’s general parameters.
Update program information:
- Click on “Program Management” and then select “Update Program Info”
- Click on the program that needs to be updated a. Program Admins can add/remove procurement agents and funding sources that already exist in QAT to their program. This will in turn, add/remove the procurement agents to the dropdown fields in the Shipment Data entry screens. If a user would like to add a procurement agent to their program that does not exist in QAT, they can take out a ticket with the QAT HelpDesk system.
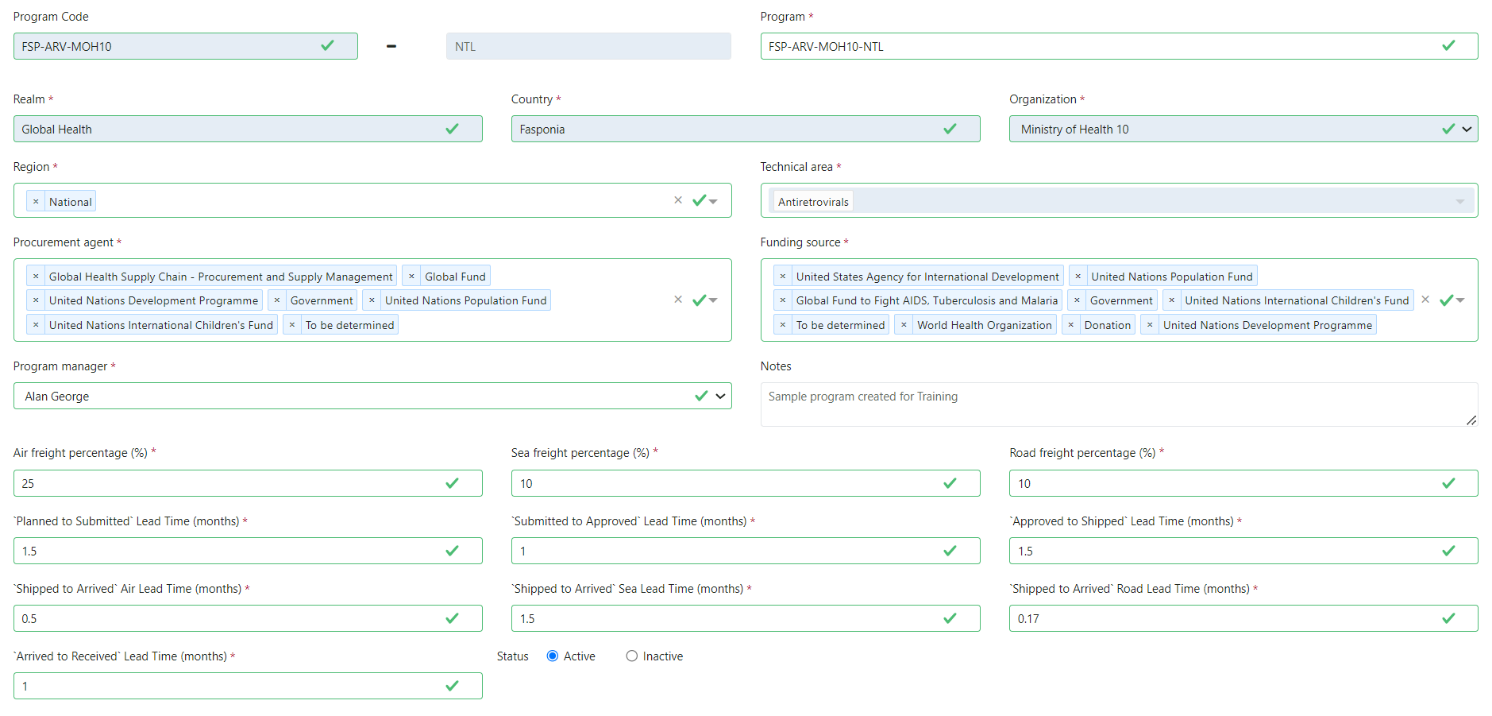
Figure 67: Update Program Info – Supply Planning Module
- Update fields as desired, and click “Submit”
[!NOTE] QAT only allows Realm-level Admin or App-level Admins to update the fields which are in gray in the Update Program Info screen. If a user requires these fields to be updated, they can take out a ticket with the QAT HelpDesk system.
4.A.2. Planning Units
The planning unit is the product used in QAT as the basis for planning procurements, and displaying consumption, shipments, inventory, and adjustments. A planning unit name is usually inclusive of a full description up to the primary packaging; thus, its nomenclature closely follows the pack size in which dispensing happens, i.e., one bottle of 30 tablets, blister of 10x10 capsules, etc.
The QAT planning unit catalog is considered realm-level master data, meaning any additions / edits / subtractions from that catalog are managed at the realm-level and apply to all programs within that realm.
Every program must have at least one planning unit that Program Admins can select from the realm-level catalog to add to their programs or deactivate from their programs. Program Admins can also update any parameter related to a particular planning unit, including the reorder frequency, minimum months of stock, average monthly consumption calculation, local procurement agent lead time, shelf life, and price. Planning units can be deactivated from the program if no longer in use, allowing the program admins to keep all the legacy data. If the planning unit does not exist in the QAT catalog, please raise a ticket through the QAT Helpdesk so that it can be created for the entire realm. See more on ticketing in section QAT Helpdesk and Tickets.
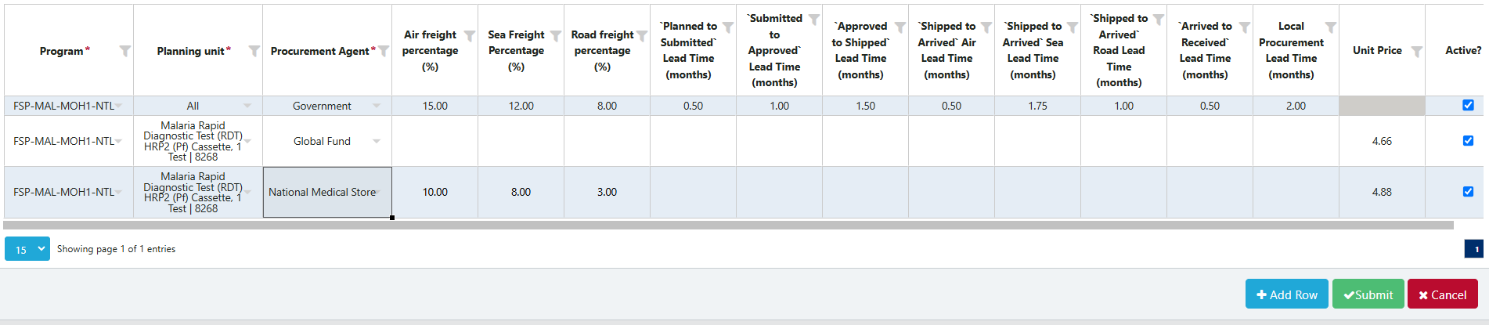
Figure 69: Parameters to update per planning unit.
Planning Unit Parameters:
- Conversion Factor (FU:PU): A non-editable field providing information on the conversion factor between the chosen PU and its associated FU
- Plan By: choose between “MOS” for those planning units that are consumed in large quantities or “Quantity” for those planning units that are consumed in low quantities, or for emergency purposes with high expiries
- Reorder Interval (in months): the number of months between shipments. Reorder interval + Min MOS = Max MOS
- Min Months of Stock (MOS): the minimum amount of inventory, in months, that should be available on-hand to meet demand and avoid stockouts
- Min Quantity: the minimum quantity of inventory that is determined to be needed on-hand
- Average Monthly Consumption (AMC) calculation: which is the average quantity a product is used over a selected period of time, will take an average of the program admin-entered values for “Months in future (including current month)” and “Months in past”
- Local Procurement Lead Time: the entire lead time (‘planned to received’), in months, for locally procured planning units. Ideally in local procurement, the lead time would be much shorter than that for international.
- Distribution Lead Time: Number of months between shipment receipt and the product to be distributed down to the lowest level. Used for suggested shipments ahead of understock.
- Shelf Life: number of months from shipment receipt (status = received) until expiry. This is an average number of months for the planning unit – for entering exact batch data, including expiry dates see Supply Planning: Project Expired Stock and Batch Information
- Forecast Error Threshold (%): a value used in the Forecast Error (Monthly) and Forecast Error (by PU) consumption reports as a demarcation of whether a forecast error is deemed too high
- Catalog Price: average price of a single planning unit, which will be used in calculating shipment costs. Price per program and procurement agent can be more granularly updated in Program/Procurement Agent-specific Information or specific shipment prices can be updated in the Shipment data entry screen.
- Notes: a free text field to add relevant planning unit information (i.e. phasing-in/out timelines, if the planning unit is central/national-level data, etc.). These notes are available for viewing in the Supply Plan report, Supply Plan Version & Review Supply Planning screen, Supply Planning screen, & Scenario Planning screen.
Update planning units within a program:
- Ensure that you are working in ‘online’ mode. Select “Program Management” and then “Update Planning Units”
- Select the program to display the planning units currently managed a. If intending to update or reactivate a deactivated planning unit, choose “Inactive” from the planning unit Status dropdown
- Double-click on the cell (parameter) that needs updating
- Click “Submit” to save the changes
Add planning units to a program:
- Ensure that you are working in ‘online’ mode. Select “Program Management” and then “Update Planning Units”.
- Select the program to display the planning units currently managed
- Click on the blue “Add Row” button on the bottom right of the screen and a new row will appear at the top of the table. a. Alternatively, right-click on any row in the table and select “Insert new row before” or “Insert new row after”.
- Begin by typing the first three letters of the desired planning unit to be added
- Complete all the cells (parameters) in that row
- Click “Submit” to save the changes
[!NOTE] If a required planning unit is not available in the dropdown, and thus on the QAT catalog, please raise a ticket through the QAT Helpdesk so that it can be created for the entire realm. See more on ticketing in section QAT Helpdesk and Tickets.
4.A.3. Program/Procurement Agent-specific Information
QAT users can manage specific details (freight costs, lead times, unit costs) for procurement agents and planning units within a supply plan. Program procurement agent-specific prices can be set for each planning unit in their programs, in addition to the program’s default (catalog) prices or realm-level procurement agent catalog prices. For example, a user may want to enter the UNDP price for malaria rapid diagnostic tests (mRDT) in the program FASPonia-Malaria, if UNDP’s catalog is not available at the realm level. Users also have the ability to designate freight percentages, lead times (including local lead times), and unit prices for specific planning units, procurement agents, or a combination of the two.
Features and Rules:
- Program + Procurement Agent Combination: If creating a program and procurement agent combination, the price column will become non-editable if the planning unit is set to ‘All’ since the price already exists in a different screen.
- Freight Costs, Lead Times, and Unit Prices: At least one of these columns must have a numeric value when adding or editing rows.
- Mandatory Fields: Only the first three columns (Program, Planning Unit, and Procurement Agent) are required to add a row.
- Constraints:
- Only one row is allowed per program/planning unit/procurement agent combination.
- If a procurement agent row includes 'All' planning units, the unit price column will be non-editable.
Usage in Supply Planning Module: These program/procurement agent/planning unit-specific details will impact the supply planning module as follows:
- Freight Percentages: Prioritized by program/procurement agent/planning unit settings and then program settings.
- Lead Times: Prioritized by program/procurement agent/planning unit settings, then program settings, and finally realm-level procurement agent settings.
- Unit Prices: Prioritized by program/procurement agent/planning unit settings, then realm-level procurement agent settings, and finally program settings.
Steps to Add or Edit Program/Procurement Agent-specific info:
- Select “Program Management” and then “Update Planning Units”.
- Select the program to display the planning units currently managed.
- Right-click on the row of the planning unit to add the procurement agent price for and click on “Add Program/Procurement Agent Prices” to show a new screen.
Figure 70. Accessing the Program/Procurement Agent Prices screen
- OR select “Program/Procurement Agent Info” from the lefthand menu to go directly to the screen.
- Select the program(s) and planning unit(s) to enter information for.
- Fill in the required fields and any additional fields. A few reminders from above: a. If creating a program and procurement agent combination, the price column will become non-editable if the planning unit is set to ‘All’ since the price already exists in a different screen. b. At least one of these columns must have a numeric value when adding or editing rows. c. Only the first three columns (Program, Planning Unit, and Procurement Agent) are required to add a row. d. Only one row is allowed per program/planning unit/procurement agent combination.
- Click “Submit” to save the changes.
- Click on Master Data Sync after making changes (applies to any item under Program Management).
4.A.4. Alternate Reporting Units
An alternate reporting unit (ARU) is the product and unit that the country’s data (consumption, inventory & adjustments) is reported in and it could have the same description as the planning unit, forecasting unit, procurement unit, or in an altogether different packaging description. The ARU is defined within a particular country and requires entering a conversion factor from the ARU to the planning unit it is associated with (could be 1). Of all the product masters, the ARU is the only one program admins manage, because they are country specific. Application, Realm, and Program Admins can add/edit ARU for a country and program. Alternate reporting units are useful when:
- Data sources report data in different units (e.g. pieces vs packs)
- There’s another common name in country (e.g. brand name)
To see the list of all alternate reporting units in one country:
- Select “Program Management” and then “Alternate Reporting Unit”.
- Select the program from the dropdown.
To add alternate reporting units to a country:
- Select “Program Management” and then “Alternate Reporting Unit”.
- Select the program from the dropdown.
- Click on the “Add Row” button at the bottom right corner of the screen, or right-click on any row to add another.
- Enter the details in the newly created row and click on “Submit”. a. Note: the conversion factor can be ‘divide’ or ‘multiply’.
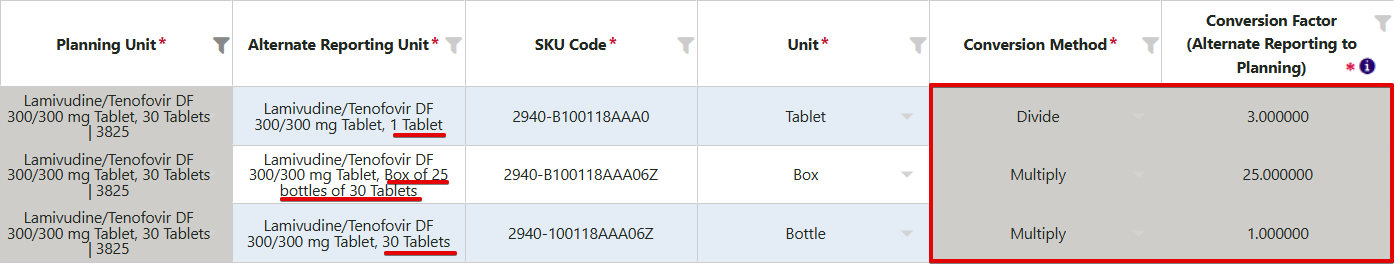
Figure 72: ARUs
*Note that for each planning unit added to a program, QAT will automatically create an Alternate Reporting Unit with a 1:1 conversion factor. QAT will use the Planning Unit description as the Alternate Reporting Unit description.
4.A.5. Default Lead Times
QAT uses six shipment statuses to track the progression of a shipment from planning to product receipt. Each of those steps in the order lifecycle has an associated lead time that is used to estimate when the next action should happen at each step. Lead times are expressed in months and can be partial months or even zero. The priority order for lead times settings is as follows: Program/Procurement Agent Info settings take the highest priority, followed by Program-level settings, and then Realm-level settings.
Planned ➔ Submitted ➔ Approved ➔ Shipped ➔ Arrived ➔ Received
Figure 73: QAT shipment statuses
There is different lead time logic depending on whether procurement is tagged as international or local.
- For international procurement:
- Program Admins manage lead times that are program/country-specific (e.g., planning time, shipment times, custom clearance times, quarantine periods, etc.)
- Realm Admins manage lead times specific to each procurement agent (more on this in the table below).
- Can also set specific lead time configurations for programs and/or procurement agents on a per-planning unit (PU) basis.
- For local procurement:
- The entire lead time (‘planned to received’) is determined by what's entered at the program level, per planning unit. All steps in local procurement are typically shorter than those in international procurement.
| Lead time (from – to) | Definition | Configuration |
|---|---|---|
| Planned to submitted | Number of months from identifying procurement need to placing an order with a procurement agent | Always set at the program level by Program Admins |
| Submitted to approved | Number of months between order placement and approval of order. This lead time can be defined for each procurement agent. | Default set at the program level by Program Admins. However, overwritten by realm-level procurement agent setting, if procurement agent is assigned to a shipment. |
| Approved to shipped | Number of months between order approval and dispatch from the procurement agent/supplier. This lead time can be defined for each procurement agent. | Default set at the program level by Program Admins. However, overwritten by realm-level procurement agent setting, if procurement agent is assigned to a shipment. |
| Shipped to arrived by air | Transit time via air between order dispatch until arrival at port of entry -in number of months. | Always set at the program level by Program Admins |
| Shipped to arrived by sea | Transit time via ocean between order dispatch via air until arrival at port of entry -in number of months. | Always set at the program level by Program Admins |
| Shipped to arrived by road | Transit time via road between order dispatch via road until arrival at requested point of delivery –in number of months. | Always set at the program level by Program Admins |
| Arrived to received | Number of months from arrival at port of entry until reception into the warehouse. | Always set at the program level by Program Admins |
Table 8: Lead times by shipment stage - definitions
Priority Order for Lead Time Settings: The priority order for lead time configurations is as follows:
- Program/Procurement Agent Info: These settings take the highest priority. If lead times are defined at this level, they will override other settings. These can be updated in the ‘Program/Procurement Agent Info’ screen.
- Program-level: If no lead time is defined at the program/procurement agent level, the program level defaults will be used. These can be updated in the ‘Update Program Info’ and ‘Update Planning Units’ screens.
- Realm-level: Realm-level lead times will apply if no specific lead time is set at the program level.
Enter/update the default lead times at the program level:
- Go to “Program Management” and then click on “Update Program Info” (see Updating Program Information).
- Scroll down to the second half of the page where all the lead time fields are.
- Enter the default program lead times per step.
- Click “Update” to save the changes.
Refer to Program/Procurement Agent Info for instructions on how to add/edit settings at a program/procurement agent level.
Enter/update the default local procurement agent lead times:
- Go to “Program Management” and then click on “Update Planning Units” (see Updating Planning Units)
- Select the program from the dropdown on the top left.
- Enter the default program lead time for local procurement.
- Click “Submit” to save the changes.
Figure 74: Entering local procurement agent lead times
4.A.6. Budgets
A budget represents an amount (estimated or actual) of capital for a set period that is to be spent on buying commodities for the program.
Go to “Program Management” and then “Budget” to view a list of all budgets for your program(s).
A budget can be tagged to one program or multiple programs. For example, if FSP-Lab-A has budget x, FSP-Lab-B can also link its program to budget x. If a program is delinked from a budget, the user will be forced to un-tag all shipments from that budget before uploading the version to the server. Any program admin that has access to a program can edit a budget that is associated with the program; however, he/she will only be able to add/remove programs that they have access to.
To add or remove programs from a budget, click into the budget and then select or de-select from the first dropdown.
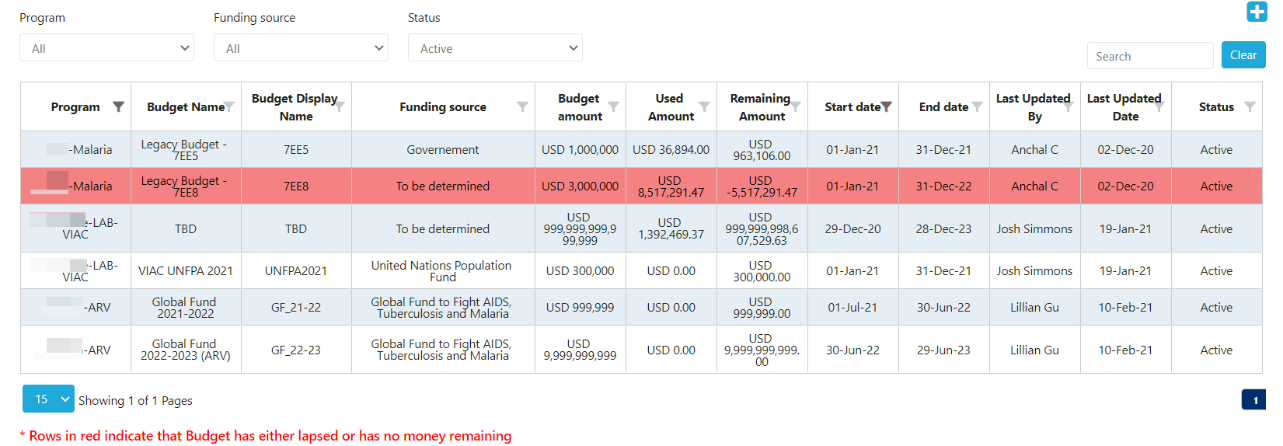
Figure 76: Budget Screen
If a budget is highlighted in red, it indicates that the budget has either passed the ‘End Date’ and/or the ‘Used Amount’ has exceeded the ‘Budget Amount’.
Add a Budget:
- In the “Budget” screen, go to the top right corner and click on the blue “+” icon.
- A new screen titled “Add Budget” will appear.
- Enter the required details.
- Click the “Submit” button. a. Note: A Program cannot have multiple budgets with the same Funding Source and Budget Display Name. An error message will pop up if this is the case.
Update a Budget:
- Go to the Budget screen.
- Left click on the budget that you want to update.
- A new screen will appear titled “Update Budget”
- Update the details of the selected budget as appropriate.
- Click “Submit” to save the changes.
Figure 77: Update Budget
4.B. Transactional Supply Plan Data
There are 3 main data requirements when creating or updating a supply plan: consumption, inventory, and shipments. The section below will define each of the data elements and how to add/update those elements in QAT.
- Consumption: Stock dispensed by the program to clients.
- Actual Consumption: The reported quantity of a product dispensed to clients in a given time period for a specific program at a specific supply chain level or combination of levels.
- Forecasted Consumption: The quantity predicted to be consumed by clients in a given time period which has been agreed upon by the program.
- Inventory: The quantity on hand of usable product at a specific supply chain level or combination of levels, on a specific date, for a specific product.
- Stock count: A check of how much stock a program has at a particular time in a specific supply chain level or combination of levels.
- Stock adjustments: Positive or negative modifications to usable inventory quantities for a specific date, categorized by reason for the adjustment, if possible (e.g. damage, expiry, quarantine, transfer to another implementing partner, etc.). Rebalancing transfers between locations in the same supply chain are excluded.
- Shipments: The quantity of funded or planned quantities that will ship in current or future month or has shipped in a previous month or that has been received. Expressed in individual shipments, with a shipment number, and expected receipt date.
4.B.1. Consumption Data
Add Consumption Data:
- From the menu sidebar, go to “Supply Plan Data” and click “Consumption Data”.
- Once the “Consumption Data” screen appears, select the desired filters using the drop-down menus at the top.
- The screen will display all current data for the selected period, planning unit(s), and other filters selected in step 2.
- To add a new consumption record, right click on any cell and select “Add new consumption” OR select the blue “+ Add row” at the bottom.
- Enter the required information and click “Submit”. a. Any cell that is greyed out (e.g. Quantity (PU)) indicates that it is a QAT generated cell and cannot be manually entered/edited. i. Reminder that Alternate Reporting Unit (ARU) is the product and the unit that the country’s data is reported in. This could be the same as the planning unit or may be different. QAT users can define an alternate reporting unit and a conversion factor (multiply or divide) to the planning unit. b. Any cell that is highlighted yellow indicates that it is a required field and has not yet been entered by the user.
Notes on Consumption Data:
- For each month and each region, user may enter one forecasted consumption record, and one actual consumption record.
- Users may not enter actual consumption for months in the future.
- Users may not edit forecasted consumption more than nine (9) months in the past and may not edit actual consumption more than nine (9) months in the past.
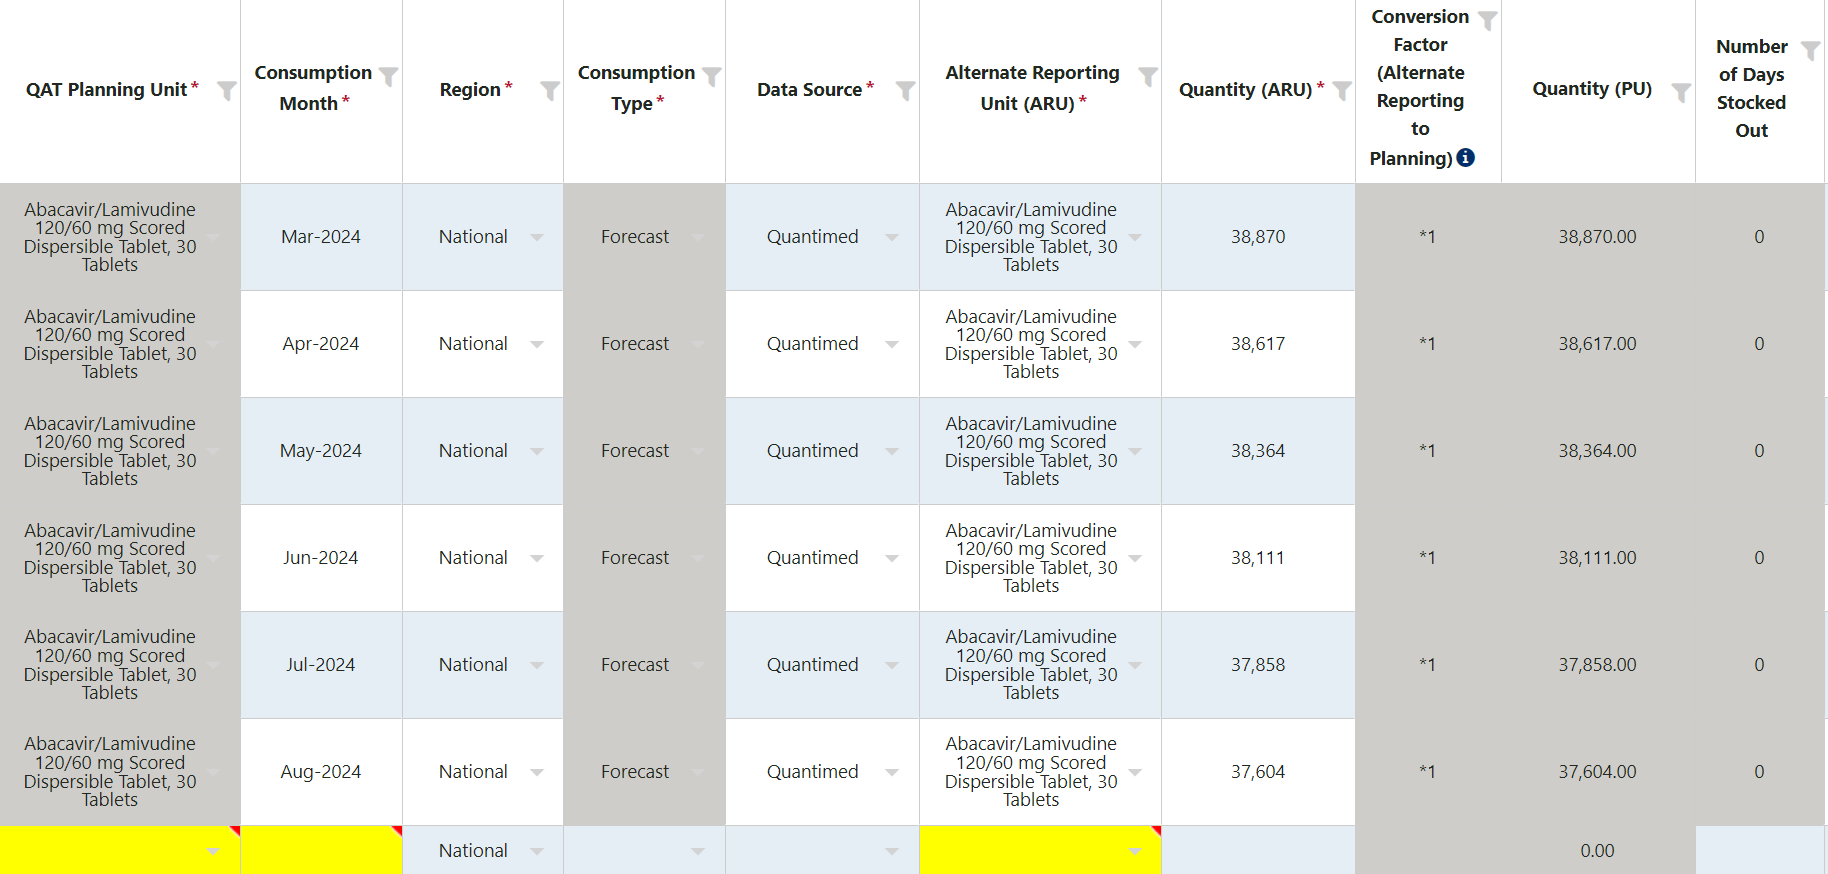
Figure 78: Add Consumption Data
Update consumption data:
- From the menu sidebar, go to “Supply Plan Data” and click “Consumption Data”.
- Once the “Consumption Data” screen appears, select the desired filters using the drop-down menus at the top.
- The screen will display all current data for the report period, planning unit(s) and other filters selected in step 2.
- To update existing consumption data, the user must double-click on the cell(s). A user can update as many cells for as many rows as they need to before saving as long as it is for the same dropdown filters selected in step 2. a. Note: Users may not edit forecasted consumption more than nine (9) months in the past and may not edit actual consumption more than nine (9) months in the past. The non-editable data is identified by greyed out rows.
- Once a consumption record has been saved in QAT, it cannot be deleted. Therefore, if a user wants to remove that record from the supply plan, he/she must de-activate it by checking the blue check box in the far-right column or it can be repurposed for a different month’s data.
- Once the update(s) have been made, click “Submit”.
Add/update batch details: Adding batch information to consumption records can only be applied to actual consumption.
- Right click on the “Actual Consumption” row and click “Show Batch Information”.
- A pop-up screen of the batch details for that actual consumption record will appear.
- The user can edit the existing batch number and/or quantity by double clicking on the cell.
- The user can also add a new batch(es) by right-clicking and selecting “Add New Batch” or by clicking on the “+Add Row” button”.
- The total quantity of the batches must equal the quantity of that actual consumption record. a. If the batch quantity/batch quantities are less than the actual consumption quantity, QAT will create a batch, using FEFO to calculate the difference. b. If the batch quantity/batch quantities are greater than the actual consumption quantity, QAT will have a validation error and not let the user submit.
- Click “Submit”.
Notes on Inventory Data:
- For each month, data source, and region, users may enter one inventory record but may enter multiple adjustments.
- Users cannot enter inventory for months in the future.
- Users may not edit inventory or adjustment records more than nine (9) months in the past.
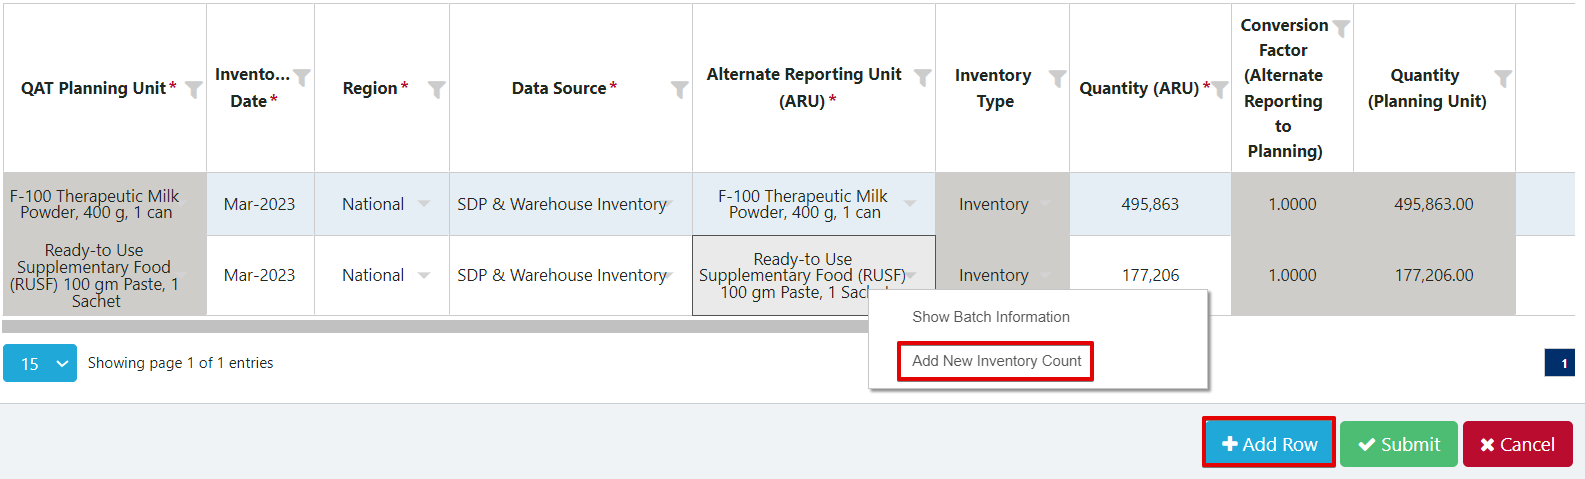
Figure 79: Batch Details
4.B.2. Inventory Data
Add Inventory/Adjustment Data:
- From the menu sidebar, go to “Supply Plan Data” and click “Inventory Data”.
- Once the “Inventory Data” screen appears, select the desired filters using the drop-down menus at the top. a. If the user is entering inventory data, select “Inventory” in the Inventory Type drop-down. If the user is entering adjustment data, select “Adjustment”.
- The screen will display all current data for the selected period, planning unit(s) and other filters selected in step 2.
- To add a new inventory/adjustment record, right click on any cell and select “Add New Inventory Count”/ “Add new adjustments” OR select the blue “+ Add row” at the bottom.
- Enter the required information. a. Any cell that is greyed out (e.g., Conversion Factor) indicates that it is a QAT generated cell and cannot be manually entered/edited. b. Any cell that is highlighted yellow indicates that it is a required field and has not yet been entered by the user. c. If entering an adjustment, a note in the “Notes” field is required. Notes for inventory records are optional.
- Click “Submit”.
Figure 80: Add Inventory
Update Inventory/Adjustment Data:
- From the menu sidebar, go to “Supply Plan Data” and click “Inventory Data”.
- Once the “Inventory Data” screen appears, select the desired filters using the drop-down menus at the top. a. If the user is updating inventory data, select “Inventory” in the Inventory Type drop-down. If the user is updating adjustment data, select “Adjustment”.
- The screen will display all current data for the report period, planning unit(s) and other filters selected in step 2.
- To update existing inventory/adjustment data, the user must double click on the cell(s). A user can update as many cells for as many rows as they need to before saving as long as it is for the same dropdown filters selected in step 2. A user also cannot update adjustment and inventory data at the same time without first saving. a. Note: Users may not edit adjustment or inventory records more than nine (9) months in the past. The non-editable data is identified by greyed out rows.
- Once an inventory record has been saved in QAT, it cannot be deleted. Therefore, if a user wants to remove that record from the supply plan, he/she must de-activate it by checking the blue check box in the far-right column or it can be repurposed for a different month’s data.
- Once the update(s) have been made, click “Submit”.
Add/Update Batch Details – Adjustments (for more information on QAT batch calculations, please see Annex 2: Business Rules or Section 5.E).
- Right click on the Adjustment row and click “Show Batch Information”.
- A pop-up screen of the batch details for that record will appear.
- The user can edit the existing batch number and/or quantity by double clicking on the cell.
- The user can also add a new batch(es) by right-clicking and selecting “Add New Batch” or by clicking on the “+Add Row” button”.
- The total quantity of the batches must equal the quantity of that adjustment record. a. If the batch quantity/batch quantities are less than the adjustment quantity, QAT will create a batch, using Best Case Scenario logic to calculate the difference. b. If the batch quantity/batch quantities are greater than the adjustment quantity, QAT will have a validation error and not let the user submit. c. Note: there is no user override for auto-adjustments, only manual adjustments.
- Click “Submit”.
Figure 81: Batch Details
Add/Update Batch Details – Inventory:
- Right click on the Inventory row and click “Show Batch Information”.
- A pop-up screen of the batch details for that record will appear in the supply planning screen. See Section 5.E for details on how to update.
4.B.3. Shipment Data
Add Shipment Data:
- From the menu sidebar, go to “Supply Plan Data” and click “Shipment Data”.
- Once the “Shipment Data” screen appears, select the desired filters using the drop-down menus at the top.
- The screen will display all current data for the report period, planning unit(s) and other filters selected in step 2.
- To add a new shipment record, right click on any cell and select “Add new shipment” OR select the blue “+ Add row” at the bottom.
- Enter the required information. a. Any cell that is greyed out (e.g. Planning Unit Cost) indicates that it is a QAT generated cell and cannot be manually entered/edited. b. Any cell that is highlighted yellow indicates that it is a required field and has not yet been entered by the user. c. Certain cells will not be available to enter data into until other cells have been filled in. For example, “Budget” cannot be selected until the user has selected a “Funding Source”. d. “QAT Shipment ID” will display as blank or ‘0’ until the program is uploaded. e. Shipments cannot be marked as ‘Received’ if the Receive Date is in the future. f. In the shipment data screen, the user may select the desired currency from a drop-down list by clicking in the appropriate cell in the currency column. Based on the currency selected, the user will get the catalog price. i. That price can be changed during data entry/updating. ii. Freight cost is based on shipment mode and procurement agent but can also be modified manually. g. If a shipment row is in red text, this means that the shipment is identified as an “Emergency Shipment”. QAT will automatically mark the shipment as an emergency shipment if the receive date falls inside the predefined lead time, meaning the shipment will most likely need to be expedited. Note: QAT will only auto-flag the emergency shipment when the shipment is first created, but QAT will stop auto-flagging after first time the shipment row is submitted. h. If a shipment is highlighted in grey, this means that the shipment is not included in the ending balance of the supply plan. Shipments can be excluded by either changing the status of the shipment to “Cancelled” OR by de-activating the shipment using the blue check box on the far left.
- Click “Submit”.
Update Shipment Data:
- From the menu sidebar, go to “Supply Plan Data” and click “Shipment Data”.
- Once the “Shipment Data” screen appears, select the desired filters using the drop-down menus at the top.
- The screen will display all current data for the report period, planning unit(s) and other filters selected in step 2.
- To update existing shipment data, the user must double click on the cell(s). A user can update as many cells for as many rows as they need to before saving as long as it is for the same dropdown filters selected in step 2 (i.e. you cannot edit shipments for a product and then edit shipments for a different product without first saving).
- When any of the following elements are changed (quantity, ARU, shipment mode, procurement agent, and planning unit cost), the behavior of the freight cost field will depend on the status of the “Auto-calculated Freight Cost” checkbox: a. Checked: i. The freight cost will be automatically recalculated based on the program/planning unit settings. ii. This calculation uses the formula: Planning Unit cost * Freight %. b. Unchecked: i. The freight cost cell will have a red triangle in the right corner appear recommending the user to update the freight cost the first time the checkbox is unchecked. ii. To facilitate manual entry, the user can input a formula directly into the cell by typing an ‘=’ first. The formula will disappear upon saving, but the resulting value will remain. The user can also input a number directly.
- Unlike consumption data, a user can delete a shipment record even after it has been saved to the program, although the shipment must be in the ‘Planned’ status. To do so, right-click on the desired shipment and select ‘Delete Row’.
- Once the update(s) have been made, click “Submit”.
Add/Update Batch Details: Adding batch information to shipment records can be applied to shipments in any status other than “suggested shipments”. Once a shipment is created, QAT will auto-generate a batch. The user has the ability to edit that batch and/or add new batches to that shipment.
- Right click on the shipment row and click “Show Batch Information”.
- A pop-up screen of the batch details for that shipment will appear.
- The user can edit the existing batch number, expiry date and quantity by double clicking on the cell.
- The user can also add a new batch(es) by right-clicking and selecting “Add New Batch” or by clicking on the “+Add Row” button”.
- The total quantity of the batches must equal the quantity of that shipment. At the bottom of the pop-up screen will display the total quantity for the shipment as well as the total quantity assigned to the batch(es). This is to let the user know if the batch quantity is over, under, or the same as the shipment quantity.
- Click “Save Batch Information”.
- Note: When a shipment status is changed to “Received,” the batch details will automatically pop-up for users to edit or confirm the current batch information.
The column to the far right labeled “Auto Generated” will let the user know if that batch was auto-generated by QAT or manually entered by the user. If any of the 3 fields of the batch (batch number, expiry date, quantity) are changed, the checkbox for the auto-generated field will become unchecked. If the expiry date and/or quantity are changed but not the batch number, the batch number automatically changes to swap out ‘QAT’ for ‘MAN’ and the cell gets highlighted with a red triangle indicating to the user that it should be changed. If the user doesn’t know the real batch number, QAT will allow the batch to still be saved without changing the number.
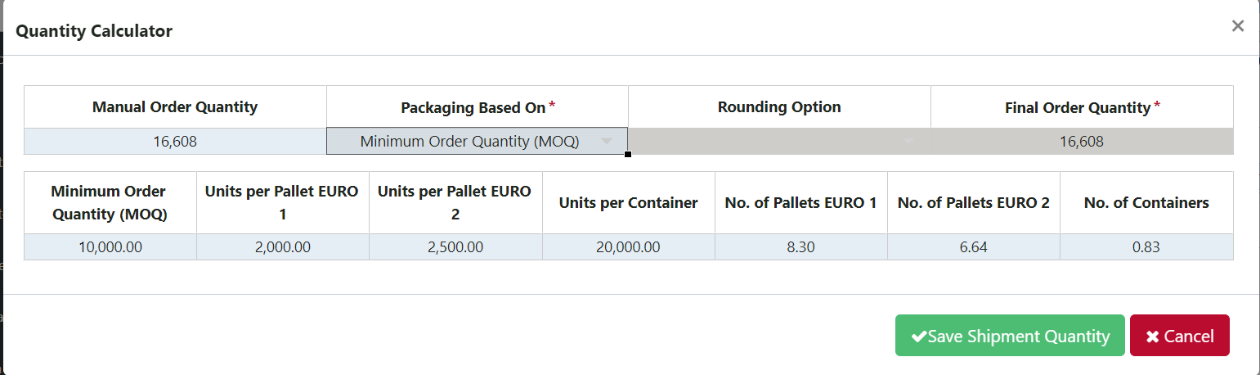
Figure 82: Shipment Batch Details
Strategic Order Calculator: For specific planning unit and procurement agent combinations, a strategic order calculator may appear for the user when entering the quantity of a shipment. The purpose of the calculator is to advise users on the appropriate order quantity for a shipment based on one or more of the following elements: a) Minimum Order Quantity (MOQ); b) Container load; c) Euro 1 pallet; d) Euro 2 Pallet. The calculator will help users plan shipments to maximize efficiency with delivery logistics (e.g. utilizing a full container instead of 20% of the container). Strategic products are defined at the realm level by an application or realm admin. For more information on how to define strategic products, see the section on adding planning units for procurement agents.
- To view the Quantity Calculator for a strategic product, double click on the cell under the “Order Quantity” column and the “Quantity Calculator” screen will appear. Note: If the product is a non-strategic product, the user can directly modify the order quantity in the cell after double-clicking and there will not be a pop-up.
- The original quantity of the shipment will appear in the “Manual Order Quantity” cell.
- If you don’t want to use the strategic calculator and want to use the original “Manual Order Quantity”, select “None” in the drop-down for “Packaging Based On” and click “Save Shipment Quantity”.
- If you want to use the strategic calculator: a. Select how you wish to use the calculator by choosing an option from the “Packaging Based On” drop-down as well as the “Rounding Option” drop-down. b. Depending on your selections in step 4a, the quantity in “Final Order Quantity” cell will show you QAT’s calculated shipment quantity. The bottom table summarizes the key information around the different packaging modes. c. After confirming you are happy with the Final Order Quantity, click “Save Shipment Quantity”.
Figure 83: Strategic Order Calculator
View Shipment Dates: Estimated for each status can be seen, and actual dates can be manually entered, in the Shipment screen. This will allow the user to identify if the shipment is on schedule or behind/ahead based on the lead times. The user can also use this screen to compare the actual dates with the estimated dates of that shipment and use that information to update lead times that may not be accurate.
- From the menu sidebar, go to “Supply Plan Data” and click “Shipment Data”.
- Once the “Shipment Data” screen appears, select the desired filters using the drop-down menus at the top.
- The screen will display all current data for the report period, planning unit and other filters selected in step 2.
- Right-click on the shipment you wish to view the dates for and select “Show shipment dates”. A pop-up screen labeled “Shipment Dates” will appear.
- The row labeled “Estimated” of the “Shipment Dates” screen will show a date for each status of the shipment based on the lead times entered for the program as well as the estimated receive date. Only the estimated receive date can be edited by the user. a. If a user changes the estimated receive date, the other estimated dates will also change based on the program’s lead times.
- The row labeled “Actual” will allow the user to enter the actual date that each status occurred for that shipment. If a cell is greyed out in this row, it means that the shipment has not yet reached that status and a date cannot be entered.
- If the user makes a change to the estimated receive date or one of the actual dates, click “Save shipment dates”.
Figure 84: Show Shipment Dates
4.B.4. ERP Shipment Linking
The ERP shipment linking functionality allows supply planners to link select shipments (currently GHSC-PSM) with the corresponding procurement agent’s ERP system (currently ARTMIS). Once a shipment is linked in the supply plan, all the order details (status, receive date, costs, quantity, batches, etc.) will match what is in the ERP and the user will no longer need to manually update the shipment. If the packaging of the product in the ERP does not match the packaging of the planning unit in QAT, the user will have the ability to correct this through a conversion factor attribute in QAT. The user will be able to de-link the shipment if they want to manually track instead. The shipment details for these linked shipments will appear throughout QAT (Shipment Data Entry, Supply Planning, Reports, etc.). The user will be alerted if there are any key changes made in the ERP such as an order being cancelled or a product SKU changing. Users will only be able to tag shipments that are past funding source approval in ERP.
When managing ERP shipment linking, users will select either the ‘Link ERP Shipments’ or ‘ERP Shipment Notifications’ menu options. Within the ‘Link ERP Shipments’ screen there are 3 sub-screens:
- Not Linked (QAT): Use this screen to link QAT shipments with ERP orders for the first time. Users will see a list of QAT shipments, and when a user clicks on a single QAT shipment, they can choose which ERP orders that QAT shipment should be linked with.
- Linked: Users will see a list of currently linked shipments and they can update the conversion factor or notes of already linked shipments, add ERP lines to already linked QAT shipments, or de-link ERP lines from QAT shipment.
- Not Linked (ERP): Use this screen to link ERP orders to QAT for the first time. Users will see a list of ERP shipments, and when a user clicks on a single ERP shipment, they can then choose which QAT shipment that ERP shipment should be linked with. For any orders that are in the ERP that are not already in QAT, you can create a new QAT shipment in this screen.
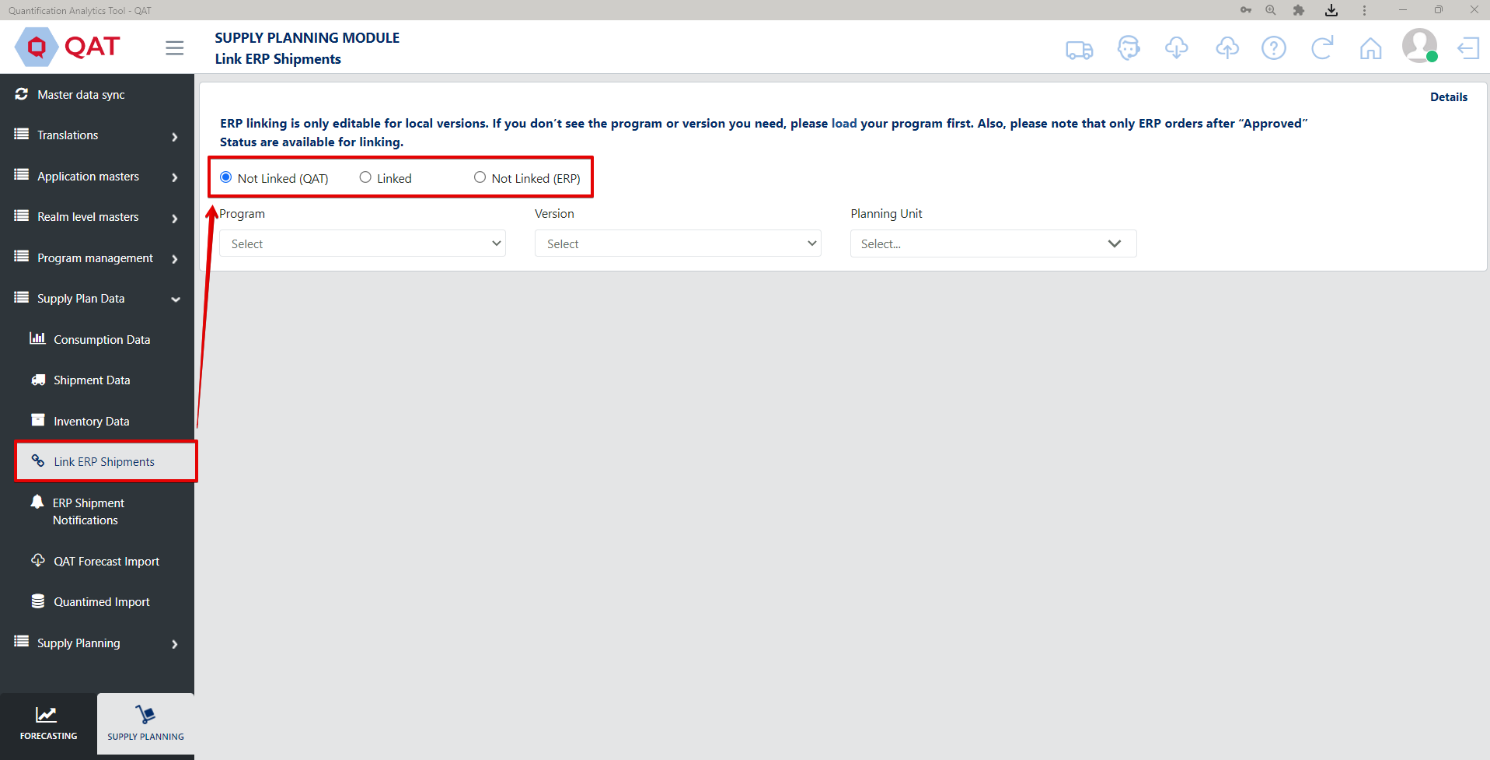
Figure 85: ERP Linking Screens
Rules for ERP Shipment Linking: Below are the rules for ERP shipment linking. The details button in the top right corner of the ‘Link ERP Shipments’ screen will summarize these rules.
- ERP linking is only editable for downloaded local versions. The ERP linking screens will show server versions, but that data is read only. To save the linking changes, the user must upload that version.
- Currently, QAT shipments can only be linked if the procurement agent is GHSC-PSM.
- QAT shipments cannot be linked if they are in the status of planned, cancelled or suggested.
- Inactive QAT shipments cannot be linked.
- QAT shipments in the ‘received’ status can only be linked if the receive date falls within the last 6 months.
- ERP orders can only be linked if they are past the funding source approval status (e.g. USAID approved).
- ERP orders in the ‘delivered’ status can only be linked if the delivery date falls within the last 6 months.
- ERP receive date uses the logic: 1) Actual Delivery Date 2) Estimated Delivery Date 3) Agreed Delivery Date 4) Requested Delivery Date. Therefore, if #1 is not available QAT will use #2. If #2 is not available QAT will use #3 and if #3 is not available QAT will use #4.
Not Linked (QAT): This screen is used by supply planners to link QAT shipments with ERP orders. Below are the steps on how to link a QAT shipment with one or multiple ERP orders:
- Select the radio button at the top labeled ‘Not Linked (QAT)’.
- Select the program and planning unit(s) you want to choose the QAT shipment from. Once selected, a list of QAT shipments will appear. ERP linking can only be done on local versions, however, linked shipments can be viewed on server versions.
- Left click on a single QAT shipment. A pop-up window will appear called ‘Search ERP-linked shipments’. This window will allow the user to choose which ERP orders that QAT shipment should be linked with. a. The top half of the window will show the QAT shipment details. This information is non-editable. b. The middle half of the window will show 2 dropdowns that will allow the user to filter the list of ERP orders to link the QAT shipment with. c. The bottom half of the window will list all ERP shipments based on the dropdowns in the middle section. This is where the user will link 1 or more orders as well as provide the Alternate Reporting Unit (ARU) and note (optional). The ARU will automatically populate the conversion factor. i. To change/add a conversion factor, the user can do so in the ‘Alternate Reporting Unit’ screen.
- In the middle section, the user can filter the ERP shipments by selecting the ERP planning unit, the RO/Order No. or both. QAT will pre-fill the RO/Order No. dropdown once this window appears by selecting the Proc Agent Order No. from the QAT shipment. If this field is blank, QAT will display a message underneath both dropdowns in red that displays “Fill either ERP planning unit or RO/Order No. to populate data”.
- To link an ERP shipment, the user will check the box in the far-left column that says ‘Link?’. Once the user does this, they will be required to enter the ARU. a. If a user wants to link multiple ERP lines to the same QAT shipment, he/she should check the box for multiple rows. b. If a user wants to link multiple QAT shipments to 1 or multiple ERP lines, he/she should check the box at the top that says ‘Show all shipments for ______’ and then select each of the QAT shipments to link.
- The conversion factor is useful when the QAT planning unit and ERP product are different (pack of 10 chocolate bars vs. pack of 100 chocolate bars). The conversion factor is used to calculate what the converted QAT shipment quantity is. The converted QAT shipment quantity is the order quantity that will be used in your supply plan for the linked shipment.
- If there is a note in the QAT shipment, this will carry over to each of the ERP orders when you link. In this pop-up window, the user can edit or delete that note.
- The bottom of the window will show what the original QAT quantity order is and what the new converted QAT quantity will be.
Figure 86: ERP Converted Quantity
- Lastly, click ‘Link Shipment’.
Not Linked (ERP): This screen is used by supply planners to link ERP orders to QAT for the first time. For any orders that are in the ERP that are not already in QAT, you can create a new QAT shipment in this screen. Below are the steps on how to link an ERP order with a QAT shipment:
- Select the radio button at the top labeled ‘Not Linked (ERP)’.
- Select the country AND planning unit category or planning unit you want to choose the ERP order from. Once selected, a list of ERP orders will appear. a. Note: This list is showing ERP data whereas the Not Linked (QAT) screen shows QAT data.
- Left click on a single ERP order. A pop-up window will appear called ‘Search ERP-linked shipments’. This window will allow the user to link 1 or more ERP orders with a pre-existing or new QAT shipment. a. The top half of the window will show the QAT shipment details. This area will allow the user to either select a pre-existing QAT shipment or create a new one. Steps 4 and 5 will detail how to do so. b. The middle half of the window will show 2 dropdowns that will allow the use to filter the list of ERP orders to link the QAT shipment with. c. The bottom half of the window will list all ERP shipments based on the dropdowns in the middle section. This is where the user will link 1 or more orders as well as provide the conversion factor and note. This section is pre-populated based on the ERP order number that was selected on the previous screen.
- To select an existing QAT shipment, click on the ‘Select Existing Shipment’ button in the top section. a. Select the program that you want to search the QAT shipment(s) from. The dropdown will be filtered to show only the country that was selected in step 2. b. Next, either search the list of QAT shipments by planning unit (default) or by QAT shipment ID. If you want to search by QAT shipment ID, you will need to check the box that is labeled ‘Filter by QAT shipment id?’. To go back to searching by planning unit, you will uncheck the box. c. Once you find the desired QAT shipment, select the button in the far-left column labeled ‘Select shipment id’.
- To create a new QAT shipment, click on the ‘Create New Shipment’ button in the top section. a. The user will need to fill in 4 dropdowns (Program, Planning Unit, Funding Source, Budget) to provide required information for creating the shipment. The rest of the shipment details will come from the ERP order that is selected in step 7. i. The program dropdown is filtered to show only the country that was selected in step 2. ii. The budget dropdown is filtered based on the selection in the funding source dropdown. iii. If there is no applicable budget, the user will need to leave the screen and add a budget in master data. If the user adds a budget, he/she must master data sync before seeing that option appear in this screen.
- In the middle section, QAT will pre-fill the RO/Order No. dropdown once this window appears based on the selected ERP order made in step 3.
- To link an ERP shipment, the user will check the box in the far-left column that says ‘Link?’. Once the user does this, they will be required to enter the ARU. a. If a user wants to link multiple ERP lines to the same QAT shipment, he/she should check the box for multiple rows. b. If a user wants to link multiple QAT shipments to 1 or multiple ERP lines, he/she should check the box at the top that says ‘Show all shipments for ______’ and then select each of the QAT shipments to link.
- The conversion factor is useful when the QAT planning unit and ERP product are different (pack of 10 chocolate bars vs. pack of 100 chocolate bars). The conversion factor is used to calculate what the converted QAT shipment quantity is. The converted QAT shipment quantity is the order quantity that will be used in your supply plan for the linked shipment.
- The user can add a note to the shipment by editing the far-right column labeled ‘Notes’.
- The bottom of the window will show what the original QAT quantity order is and what the new converted QAT quantity will be.
- Lastly, click ‘Link Shipment’.
Figure 87: Create New Shipment
Linked Screen: This screen is used by supply planners to view the list of currently linked ERP shipments and update the Alternate Report Unit (ARU) or notes, add ERP orders to already linked QAT shipments, or de-link ERP lines from the QAT shipment.
- Select the radio button at the top labeled ‘Linked’.
- Select the program and planning unit(s) you want to see the list of linked shipments for. Once selected, a list of shipments will appear. The information in these shipments is being pulled in from the ERP.
- To make any of the updates listed in step 2, left click on a single shipment. a. To edit ARU and/or notes, double-click on the cell and type or select from dropdown. b. To de-link an ERP order, uncheck the box in the ‘Link?’ column. c. To add an ERP order, check the box for that order under ‘Link?’ column. The user can clear the search dropdowns in the middle section to look up a different planning unit or order number and the originally linked orders will remain linked.
- Users will have the ability to also view order history details from the ERP. To do so, from the original ‘Linked’ screen, right-click on a single shipment and click ‘View ERP Order History’. A pop-up window will appear labeled ‘ERP Order History’. This screen will show any details that have changed over time in the ERP order. Each row indicates that one or more of the columns has changed. The furthest column on the right labeled ‘Data Received On’ is when the record was received by QAT. a. To view batch details, click on the icon. b. Note: Certain fields from the ERP are not captured on this screen so there may be some instances where 1 or more rows have the same details. This means that a column in the backend was changed.
[!NOTE] Once you have linked QAT shipments with ERP orders, the data will reflect in your supply plan without having to master data sync. The newly linked ERP data will reflect in the local reports, supply planning screen as well as the shipment data entry screen. The user does need to upload a version to the server in order for other users to see these changes.
To view the ERP-linked shipments in the shipment data entry screen, the user must select ‘ERP-linked shipments’ from the Shipment Type dropdown. The user can either display only this option or combine it with the manual shipments to show all shipments. The ERP-linked shipments will be greyed out to indicate that they are non-editable.
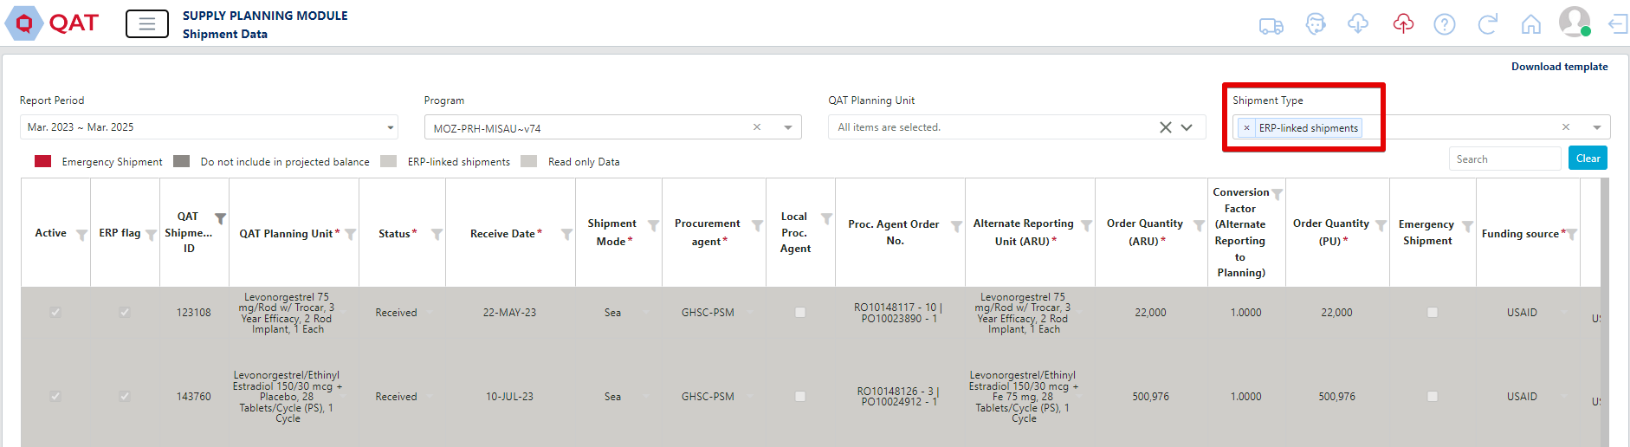
Figure 88: View ERP Shipments in Data Entry
In the supply planning screen, ERP-linked shipments will have a link icon in the top left of the cell. The user can click into a specific shipment to view the details but those cells will also be greyed out to indicate that they are non-editable. The user can still right click on the shipment details, however, to view the shipment dates and batch information.
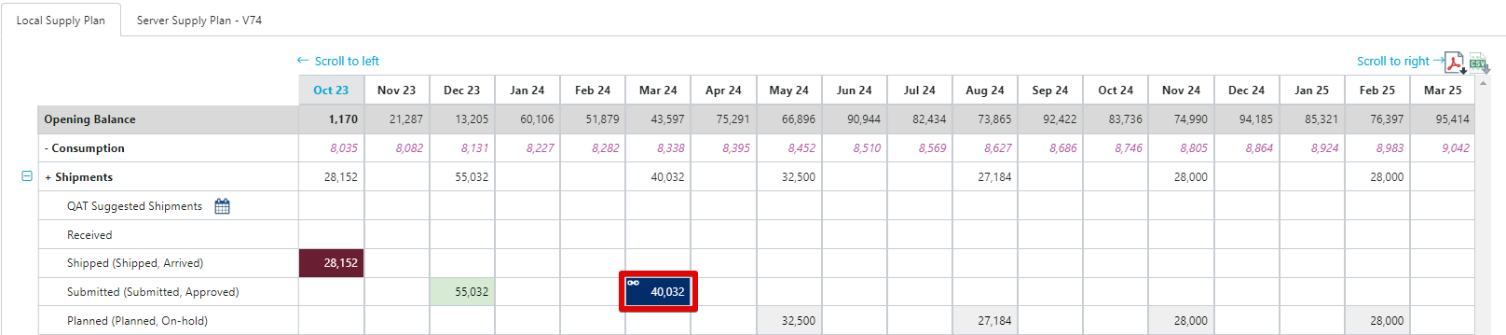
Figure 89: View ERP Shipments in Supply Plan
4.B.5. ERP Shipment Notifications
The purpose of the ‘ERP Shipment Notifications’ screen is to alert supply planners of any key changes made to ERP linked shipments, such as an order being cancelled or a product SKU changing. Supply planners will be encouraged to ‘address’ each of the notifications to confirm that they are aware of the change and the implications made on the supply plan. For product changes, the user will re-confirm the conversion factor, whether it changes or not.
At the top of the screen, there is a truck icon. This icon will display a red number indicating how many non-addressed notifications are in the ERP shipment notifications screen. If there is no red number, that means there are none.
To get to the ‘ERP Shipment Notifications’ screen, either click on the truck icon at the top of QAT or select ‘ERP Shipment Notifications’ under ‘Supply Plan Data’ in the left sidebar menu.
To view the notifications, the user will need to select from the 3 dropdowns (Program, Planning Unit, Addressed). The user also has the option to select directly from the table above the dropdowns. When a user left clicks on a row in the table, the 3 dropdowns will automatically populate based on the program that user selected. The planning unit dropdown will populate to all planning units and the addressed dropdown will select ‘Not Addressed’.
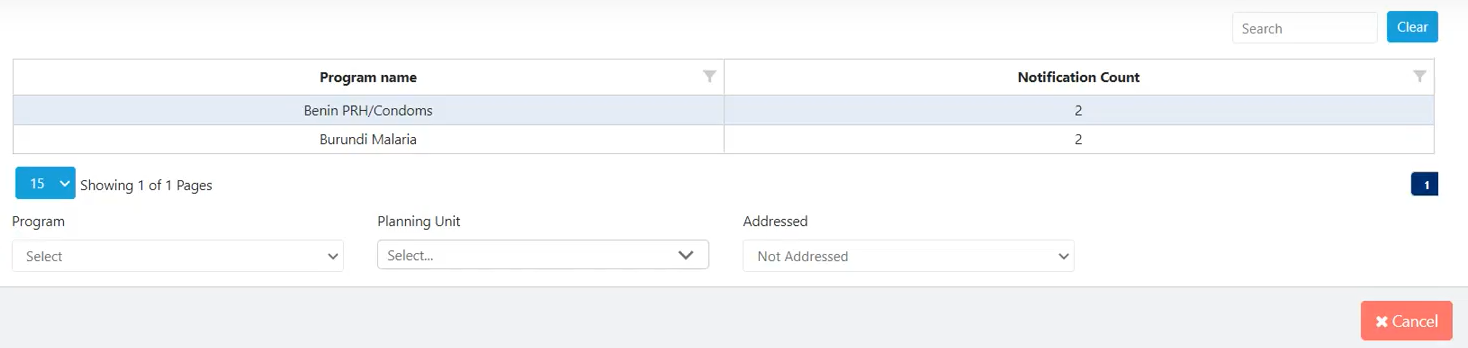
Figure 90: ERP Shipment Notifications Filtering
To address a notification, the user must check the box in the ‘Addressed?’ column and then hit the ‘Submit’ button. If the user is addressing an ERP Product Change notification, he/she must first enter the conversion factor. The conversion factor field is not editable until the addressed box is checked.
Just like in the ‘Linked’ screen, the user can view ERP order history. To do so, right-click on the notification row and click ‘View ERP Order History’. Refer to the Linked Screen section for more information.
4.C. Importing Data for Supply Planning
4.C.1. Supply Plan Data Excel Import Templates
Consumption, Inventory and Shipment data can be entered through QAT’s data entry screens, through the Supply Planning screen or through Quantimed Import (forecasted consumption only). QAT also provides users with the ability to input this data directly from Microsoft Excel. This method of data entry is intended for bulk entries that have a lot of data. The steps below will show how to input data from Excel into QAT:
Notes on Excel Templates: Each of the four data types (Inventory, Adjustment, Consumption and Shipment) have their own Excel template so it is important that you click on “Download Template” from the proper screen. For inventory and adjustment, make sure the drop-down menu has selected the type of data you want the template for.
- From the menu sidebar, go to “Supply Plan Data” and click the type of data you want to enter (e.g. “Consumption Data”).
- Once on the data entry screen, go to the top right corner and click “Download Template”.
- A Microsoft Excel file will be downloaded directly to your computer’s ‘Downloads’ folder.
- Proceed to your computer’s Downloads folder and open the Excel file. The name format should be ConsumptionDataEntryTemplate.xlsx with the first portion dependent on the type of data you are entering. a. Each of the four data types (Inventory, Adjustment, Consumption and Shipment) have their own Excel template so it is important that you click on “Download Template” from the proper screen. For inventory and adjustment, make sure the drop-down menu has selected the type of data you want the template for.
- Once in the Excel template, click “Enable Editing” at the top if it prompts you to.
![]()
Figure 91: Enable Editing
- Enter data for all of the required fields. a. Any cell highlighted in grey (e.g. Conversion Factor) is non-editable and does not need to be filled in. b. Certain fields (e.g. Data Source) will have drop down menus pre-populated from QAT. Therefore, it is important to download a new template if it has been a while since the last time the user used the template. c. Certain fields have built in data validations (e.g. letters cannot be entered in cost cells). If the validation is not met, a pop-up error message will appear.
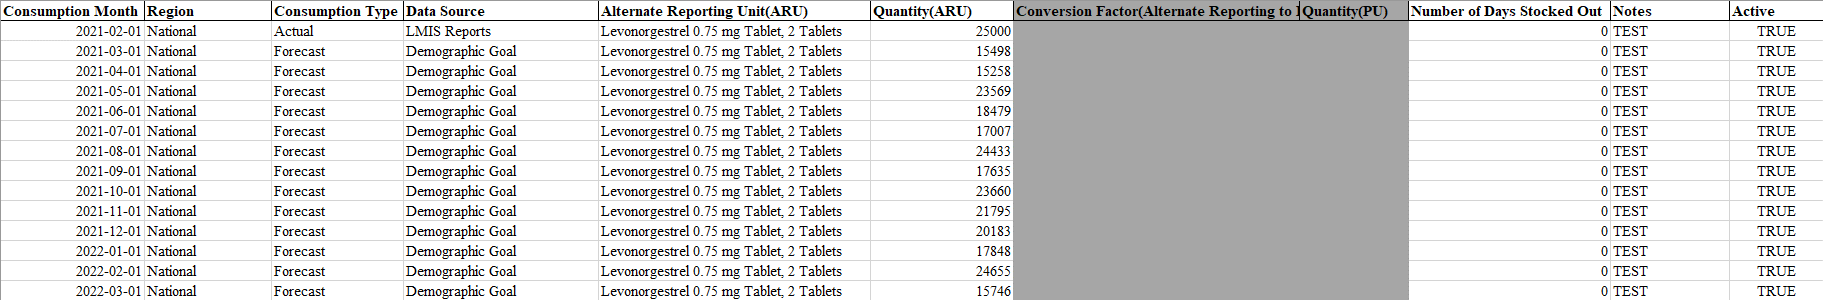
Figure 92: Excel Template
- Once all the data is entered in the Excel template, re-open QAT window.
- Go to the Data Entry screen (Consumption, Inventory, Adjustment, Shipment).
- Click the blue “+Add Row” button at the bottom. a. Note: You only need to add 1 row in QAT regardless of how many rows there are in the Excel template.
- In the Excel template, select all data and press Ctrl + C on your keyboard to copy the data.
- Go to the added row in QAT, left click on the far most left cell in that row and press Ctrl + V on your keyboard to paste the data.
- QAT will automatically create new rows for the data being imported from Excel.
- Click “Submit”.
4.C.2. Quantimed Forecast Import
Quantimed is a software designed to facilitate the process of determining the quantities of medicines and medical supplies required for a health program. The output of Quantimed is a health programs’ forecasted consumption data. That forecasted consumption data can be a key input into QAT user’s supply plans. QAT allows users to import Quantimed forecasts into QAT to include in their supply plan.
Step 1: Import Quantimed Data into QAT:
- Go to “Supply Plan Data” on the sidebar menu
- Select “Quantimed Import”
- Import Quantimed Data File a. Choose the Quantimed .xml forecast file from your local computer system. b. Select the QAT program that you want the Quantimed data to import into. c. Click on “Import”.
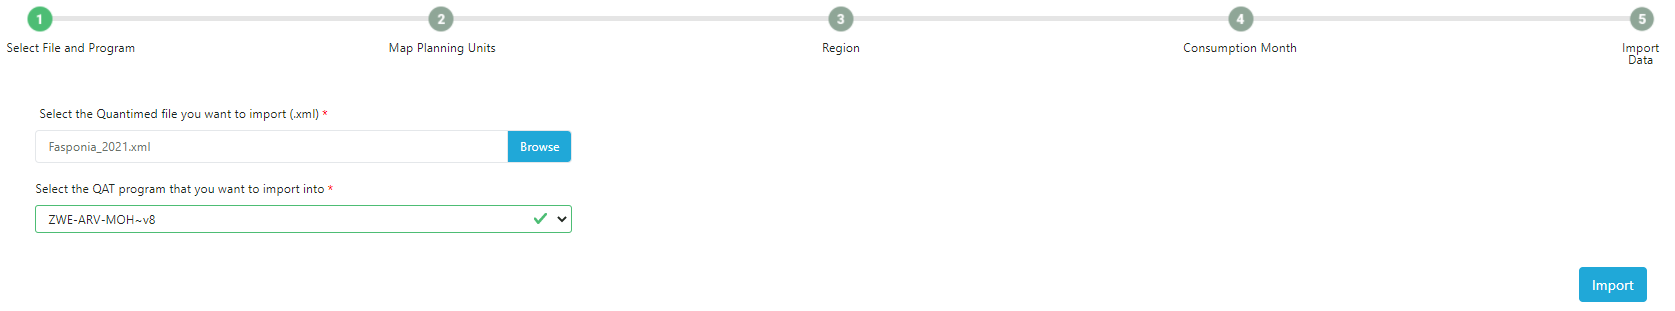
Figure 93: Quantimed File Import
Step 2: Map Planning Units:
- To map a Quantimed product to a QAT planning unit, select the QAT planning unit using the dropdown menu.
- If you do not want to import a specific Quantimed product, select the “Do Not Import” option for that row.
- If there is not a QAT planning unit associated with the Quantimed product, the dropdown will show “Planning Unit Not Found”. You will either need to manually select a planning unit from the dropdown or go back to the program and add a planning unit for that Quantimed product before proceeding. You cannot click “Next” if one or more of the cells says “Planning Unit Not Found”. a. Note: to minimize instances where a planning unit is not found, it is recommended that Quantimed users select products from the GHSC-PSM product catalog .xml file.
- Once every row has a planning unit selected or says “Do not import”, click “Next” at the bottom of the screen.
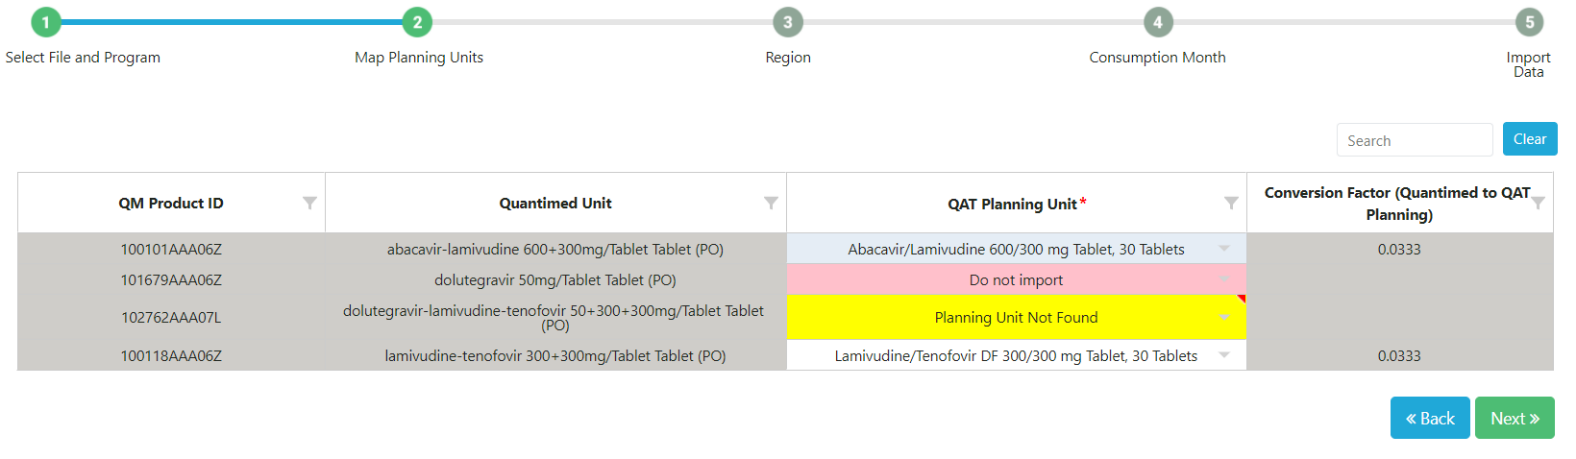
Figure 94: Map Planning Units
Step 3: Region:
- In this step select the region that you want to import the forecasted consumption data into. If there is only one region, you must select that region to proceed.
- Then, input the percentage of that consumption data that you want to import into QAT. This percentage must range from 0-100% and will apply to all the planning units previously selected.
- Click “Next”.
Step 4: Consumption Month:
- Select the date range for the Quantimed data that you want to import into QAT. a. The period you select is the period of data that you will be able to import and will apply to all planning units previously selected.
- Click “Next”.
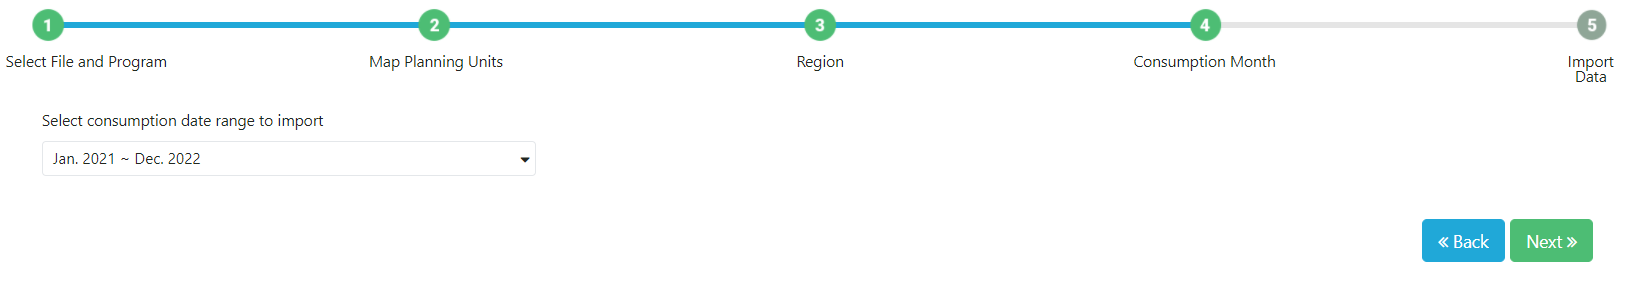
Figure 95: Consumption Month Screen
Step 5: Import Data:
- The final step is to confirm the data that will be imported from Quantimed into QAT based on what was entered in steps 1-4. a. “Quantimed Forecasted Consumption” is the amount that is being pulled in from Quantimed for the associated product and month-year. b. “Converted Quantimed Forecasted Consumption” is the amount that will be pulled into QAT for the associated product and month-year after applying the import percentage and conversion factor. c. “Current QAT Forecasted Consumption” is the forecasted consumption amount currently in QAT for that planning unit and month-year. Once you import the Quantimed data, this amount will be overwritten by the “Converted Quantimed Forecasted Consumption” amount.
- This screen will show all the data that will be imported into QAT. If you do not want to import certain records, click on the checkbox in the ‘Import?’ column on the far right. This will prevent QAT from importing the Quantimed data and will keep the current QAT forecasted consumption for that planning unit and month-year.
- Click “Submit” to import the data.
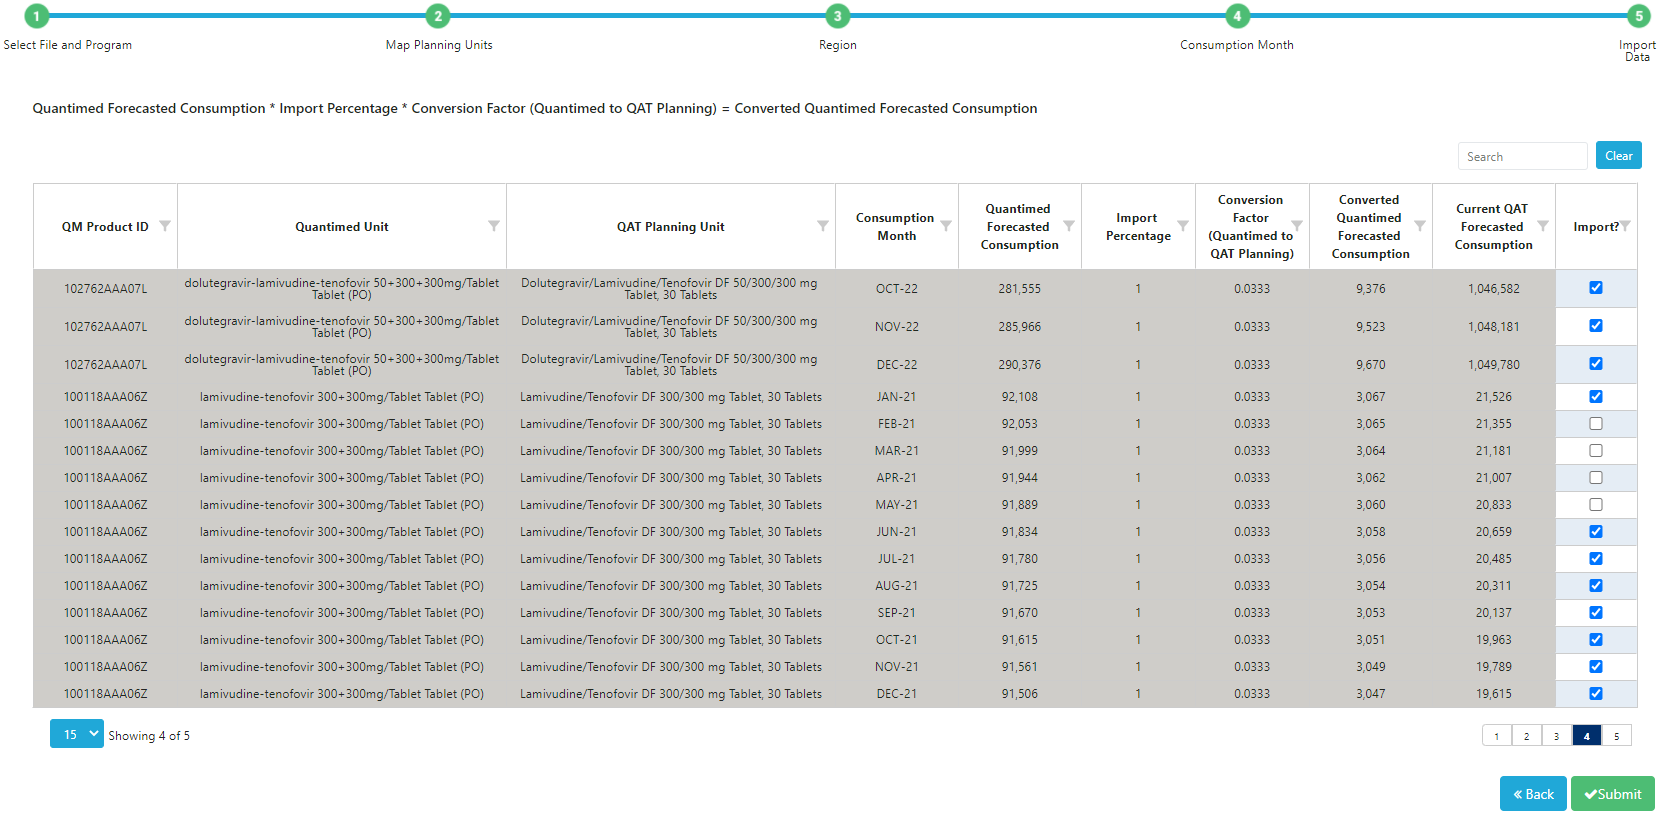
Figure 96: Confirm Data Import Screen
4.C.3. QAT Forecast Import
Purpose: Enable users to import QAT-created forecasts into supply plan programs. Forecasts are only available for importing if 1) they are uploaded as a final version and 2) there is a forecast selected for each planning unit.
Using this screen:
(Step 1)
- Select which forecast program to import from (only final forecasts are available)
- Select which supply plan program to import to. Only local supply plan versions can be used. To download a program, go to the ‘Download/Delete Program’ screen under ‘Program Management’.
- Select the date range of forecast data to import, which must be within the forecast period.
- In the table that appears, select and map planning units.
- For every Forecasting Planning Unit, QAT requires a corresponding Supply Plan Planning Unit and conversion factor. QAT automatically maps exact planning unit matches, but users can override both the planning unit mapping and conversion factor.
- Not all forecast planning units need to be imported, however, all forecast planning units must have a selection in the mapping table. You could manually select “Do not import” for each Forecasting PUs you don’t want to import or you could click on the check box “Do not import all unmapped PUs” which will allow a bulk selection of Do not import for all unmapped PUs.
- If for a PU no forecast was selected, it will appear greyed with “static.importintoSP.forecastBlank”
- If a planning unit does not appear in the dropdown, you will need to add this to the supply plan program in the ‘Update Planning Units’ screen.
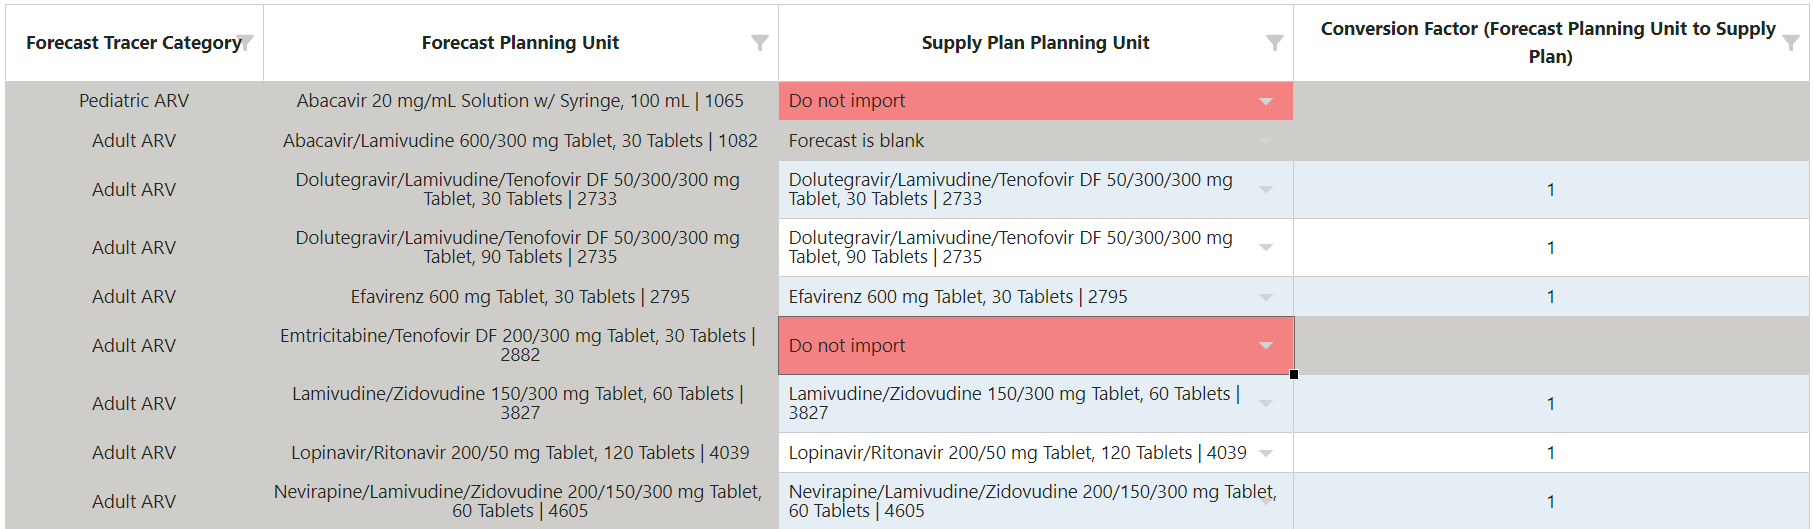
Figure 97: Forecast Import Screen
(Step 2) For each Forecast region, input how much (%) of that region’s forecast you will import and which region the forecasted consumption will be imported into. Below are some use cases:
- National forecast to national supply plan:
- Forecast Region(s): National, % of Forecast: 100, Supply Plan Region: National
- Multi-region forecast to multi-region supply plan:
- Forecast Region(s): North, % of Forecast: 100, Supply Plan Region: North
- Forecast Region(s): East, % of Forecast: 100, Supply Plan Region: East
- Forecast Region(s): South, % of Forecast: 100, Supply Plan Region: South
- Multi-region forecast to national supply plan:
- Forecast Region(s): North, % of Forecast: 100, Supply Plan Region: National
- Forecast Region(s): East, % of Forecast: 100, Supply Plan Region: National
- Forecast Region(s): South, % of Forecast: 100, Supply Plan Region: National
- National forecast to multi-region supply plan – note that the import process needs to be repeated for each supply plan region.
- Forecast Region(s): National, % of Forecast: 20, Supply Plan Region: North
- Forecast Region(s): National, % of Forecast: 45, Supply Plan Region: South
- Forecast Region(s): National, % of Forecast: 35, Supply Plan Region: East
(Step 3) QAT will list each forecast record to be imported (one row for each planning unit, region and month combination).
- QAT calculates the Forecasted Consumption to be imported as follows:
Forecasted Consumption (Forecast Module) x % of Forecast x Conversion Factor (Forecast to Supply Plan) = Rounded* Converted Forecasted Consumption
For example:
- A national forecast that will be split into two regions of 50% each.
- The Forecast Planning Unit is in packs of 3, and the Supply Plan Planning Unit is in packs of 1 (Conversion factor = 3).
- The national forecast for Month N was 100 (packs of 3).
- Forecast of 100 x 50% x 3 = 150.00 rounded (packs of 1) will be imported into each region for Month N.
*Rounding Method: Because QAT Supply Planning requires whole numbers without decimals, QAT converts forecasted consumption into whole numbers by rounding down and summing the “residuals” over time. Each month, QAT adds last month's residuals total and this month's forecast, before rounding down, and any residual not rounded down is added to a running residual total, called the Cumulative Total. In this way, quantities are not lost through the rounding process.
Formulas:
- Cumulative Total for Month N = (Residual for Month N - 1) + Converted Forecast for Month N
- Residual for Month N = How much was lost in the rounding = (Cumulative Total for Month N) – (Rounded Converted Forecast for Month N)
- Rounded Converted Forecast for Month N = Cumulative Total for Month N, rounded down to the nearest whole number
For example, a national forecast is projected to consume 0.25 packs of the Forecast Planning Unit per month, for 12 months. The Forecast Planning Unit and the Supply Plan Planning Unit are the same (Conversion factor = 1).
- In January, the Converted Consumption is 0.25, and since it’s the first month, the 0.25 is also the January Cumulative Total. 0.25 rounded down to a whole number is 0, and the rounded number of 0 is imported into the supply planning module. The January Residual from the rounding is 0.25 – 0 = 0.25.
- In February, the Converted Consumption is 0.25, added to the January Residual of 0.25 makes the February Cumulative Total 0.25 + 0.25 = 0.5. Then, 0.5 is rounded down to a whole number of 0, which is imported into the supply planning module. The February Residual from the rounding is 0.5 – 0 = 0.5.
- In March, the Converted Consumption is 0.25, added to the February Residual of 0.5 makes the March Cumulative Total 0.25 + 0.5 = 0.75. Then, 0.75 is rounded down to a whole number of 0, which is imported into the supply planning module. The March Residual from the rounding is 0.75 – 0 = 0.75.
- In April, the Converted Consumption is 0.25, added to the March Residual of 0.75 makes the April Cumulative Total 0.25 + 0.75 = 1.00. Then, 1.00 is rounded down to a whole number of 1.00, which is imported into the supply planning module. The April Residual from the rounding is 1.00 – 1.00 = 0.
- From May onwards, the cycle repeats itself.
| Month | Jan | Feb | Mar | Apr | May | Jun | Jul | Aug | Sep | Oct | Nov | Dec |
|---|---|---|---|---|---|---|---|---|---|---|---|---|
| Cumulative Total | 0.25 | 0.5 | 0.75 | 1 | 0.25 | 0.5 | 0.75 | 1 | 0.25 | 0.5 | 0.75 | 1 |
| Residual | 0.25 | 0.5 | 0.75 | 0 | 0.25 | 0.5 | 0.75 | 0 | 0.25 | 0.5 | 0.75 | 0 |
| Rounded Converted Forecast | 0 | 0 | 0 | 1 | 0 | 0 | 0 | 1 | 0 | 0 | 0 | 1 |
- If there is an existing forecasted consumption in the supply plan, the ‘Current Forecasted Consumption’ cell will be highlighted yellow.
- If there is an existing forecasted consumption in the supply plan and the forecasted consumption data the user is trying to import is older than 4 months, the ‘Current Forecasted Consumption’ cell will be highlighted gray, and will NOT be imported.
- Use the “Import?” column to de-select any forecasts that you do NOT want to import into the supply plan. If checked, the Converted Forecasted Consumption will override the Supply Plan forecast. If unchecked, the current Supply Plan forecast will remain.
Figure 98: QAT Forecast Import Screen