Section 2. Getting Started
2.A. System Requirements
The QAT is a web-based application accessible via laptops and desktops running Windows, Linux/Ubuntu, or macOS.
- Recommended Browser: Google Chrome.
- Supported Browsers: Chromium, Microsoft Edge, Mozilla Firefox, and Safari.
2.A.1 Disk Space and Cache
We recommend having sufficient free space on your primary drive (e.g., C: drive) for browser cache data. Chrome and other browsers share a storage pool among all web apps, which can be up to 1/3 of available disk space. QAT can utilize up to 20% of this shared pool. For example, with 60 GB of free space, the shared pool is 20 GB, allowing QAT to store up to 4 GB of local data.
2.B. Data Hierarchy in QAT
The QAT system is organized into three hierarchical levels:
- Application Level: The highest level, covering global master data that applies to all Realms and Programs. Restricted to Application Admins.
- Realm Level: Covers master data specific to a Realm (e.g., Country, Technical Areas, Planning Units). Managed by Realm Admins.
- Program Level: The third level, where users manage specific forecasting or supply planning data (e.g., consumption, inventory, shipments).
For detailed administrative functions, see Annex 1: Application & Realm Administrator Manual.
Note: A Program is a combination of a Country, Technical Area, Organization, and Region (e.g., FASPonia–ARV-MOH-National).
2.C User Roles and Permissions
Access to QAT is governed by roles and permissions defined at the Application or Realm level. A user can be assigned multiple roles, which may vary by program.
- Program Level: Most users (managers and officers) interact at this level as Program Admins or Program Users.
- Realm Level: Realm Admins manage master data and have access to all programs within their realm.
- Application Level: Application Admins have exclusive access to global structures, roles, and system settings.
For a full list of roles and business functions, refer to Annex 4: Business Functions.
2.D Logging In and PWA Installation
2.D.1 Initial Login (Online)
If you do not have a user profile, contact your Realm Administrator to create an account. Once created, you will receive an email to reset your password.
- Click the Reset Password link in the email (valid for 24 hours, single-use).
- Create your new password and click Submit.
- Log in using your email address and the new password.
Password Requirements:
- Minimum 6 characters, starting with a letter.
- Must include at least one uppercase letter, one number, and one special character.
- Cannot be the same as your username or previous password.
2.D.2.Installing the QAT Progressive Web Application (PWA)
The PWA provides a standalone, app-like experience on your desktop and supports offline mode. It is compatible with Google Chrome and Microsoft Edge.
Standard Installation
- Navigate to the Quantification Analytics website.
- Click the Install icon (plus sign) in the browser's address bar.
- Select Install in the confirmation pop-up.
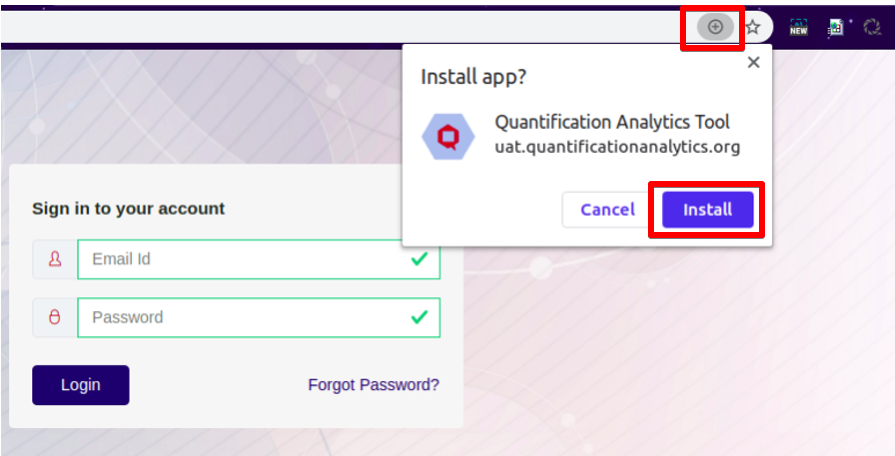 Figure 1: PWA Installation
Alternate Installation (If the button is missing)
- In Chrome, click the three vertical dots (top-right).
- Select Cast, Save, and Share > Create Shortcut.
- A QAT icon will appear on your desktop.
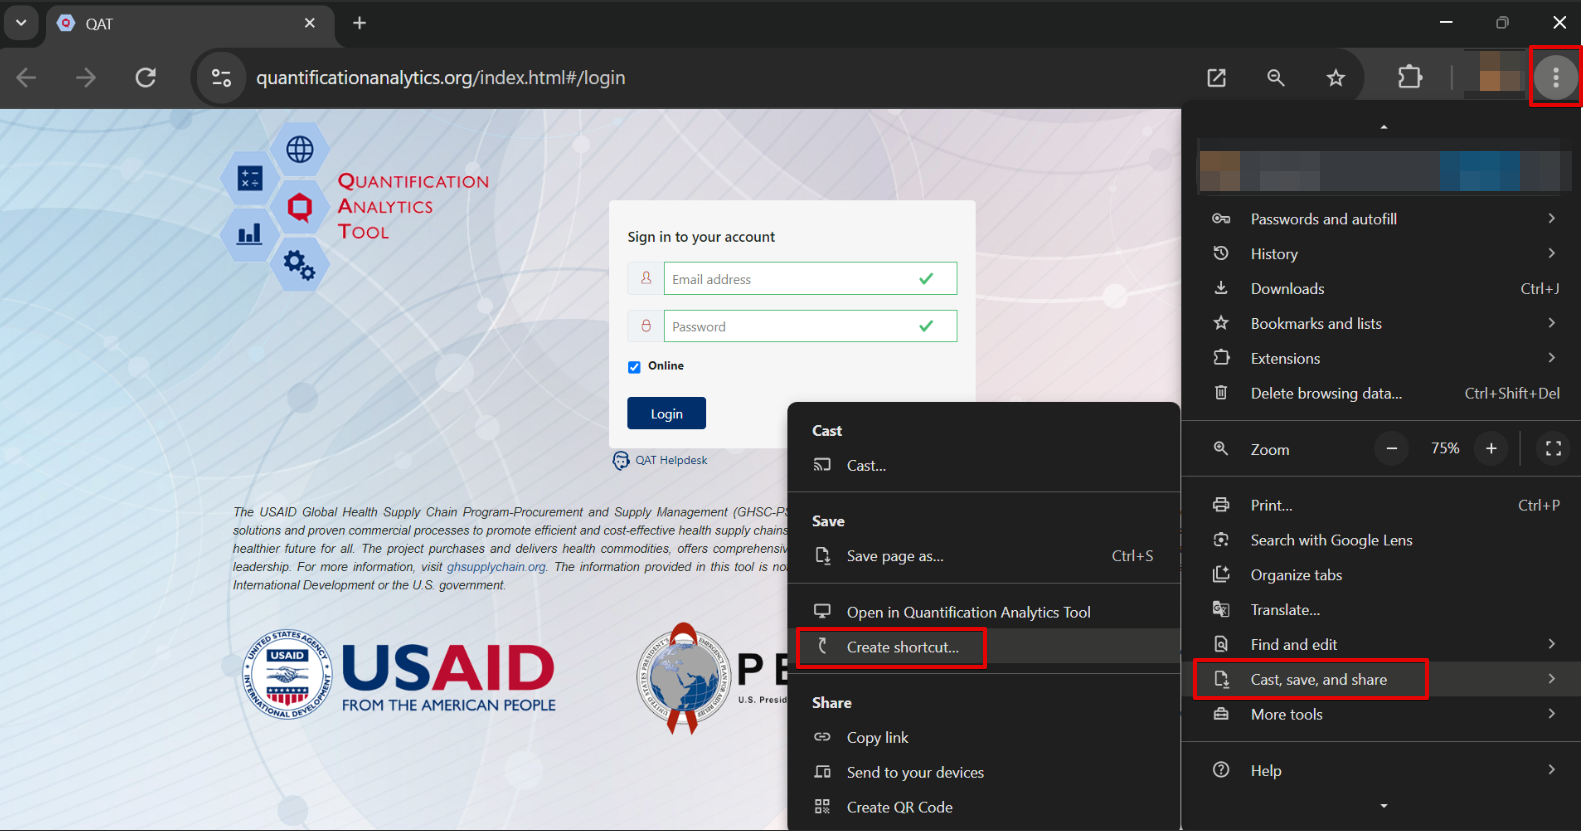 Figure 2: Alternate PWA Installation
2.E Accessing QAT for Existing Users
- Navigate to https://www.quantificationanalytics.org/ or open the PWA from your desktop.
- Enter your credentials on the login screen.
- (Optional) Check the Offline box to work without an internet connection.
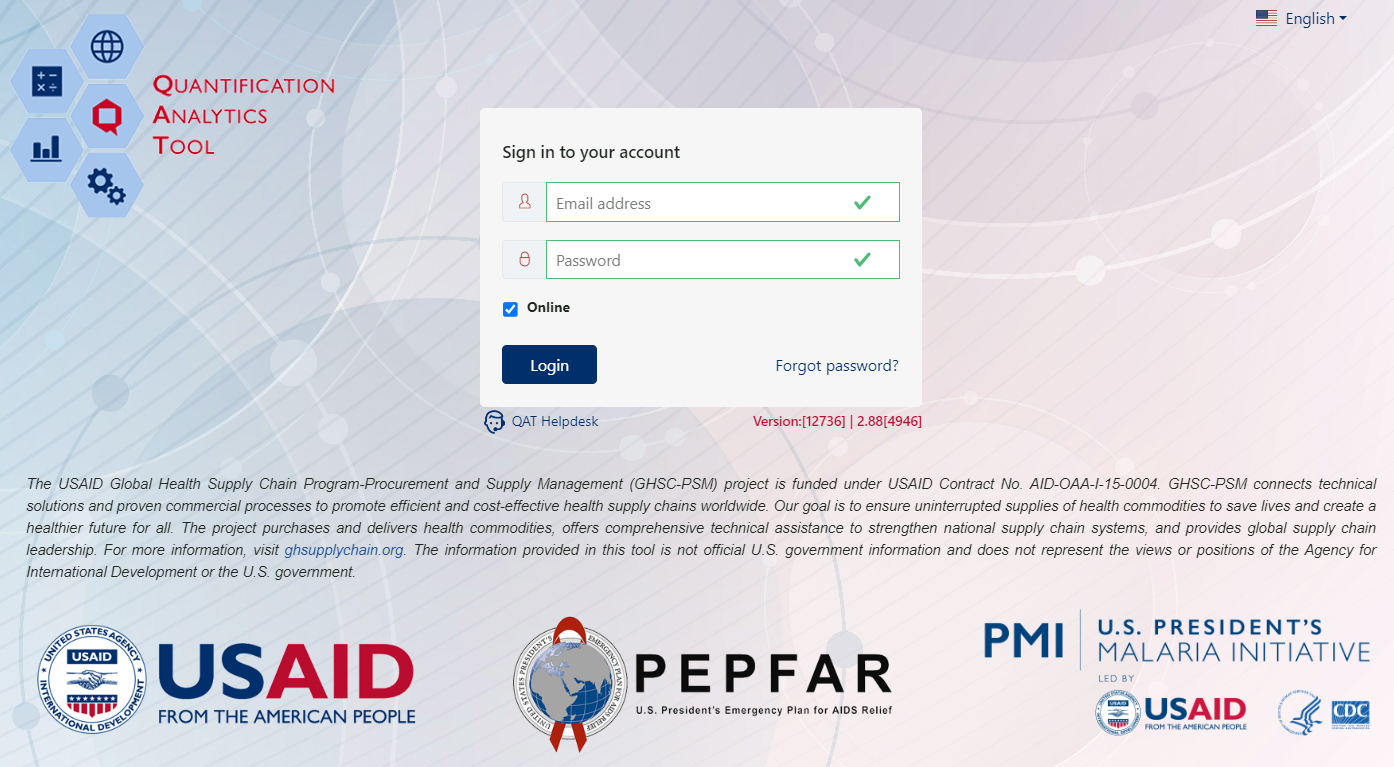 Figure 3: Login Screen
2.E.1 Security and Maintenance
- Logging Out: Click the logout icon in the top-right ribbon.
- Changing Passwords: Within QAT, go to your Profile > Change Password.
- Forgot Password: Click the Forgot Password? link on the login screen to receive a reset link via email.
Note: QAT passwords expire one year after they are created or updated.
2.F Working Offline
QAT is a hybrid tool that operates in both online and offline modes. You can manually switch to offline mode via the login page or within your profile settings. This is particularly useful in environments with low internet bandwidth.


Figure 9: Offline Toggle in Profile Settings & Figure 10: Offline Toggle on Login Page
The Profile icon in the top-right corner indicates your connection status: a green circle for online and a red circle for offline.

Figure 11: Online (Green) vs. Offline (Red) Status Icons
2.F.1 Online vs. Offline Capabilities
| Feature | Offline | Online |
|---|---|---|
| Import/Export supply plans & forecasts | [x] | [x] |
| View master data | [x] | [x] |
| Build Trees and Scenarios | [x] | [x] |
| Enter transactional & consumption data | [x] | [x] |
| Extrapolate (Moving Average / Semi-Average) | [x] | [x] |
| View program-level reports & outputs | [x] | [x] |
| Reset password | [ ] | [x] |
| Sync master data | [ ] | [x] |
| Update program info / budgets | [ ] | [x] |
| Import data between modules | [ ] | [x] |
| Extrapolate (Linear Regression / TES / ARIMA) | [ ] | [x] |
| Create helpdesk tickets | [ ] | [x] |
| Download/Upload programs | [ ] | [x] |
| View global-level reports | [ ] | [x] |
*Note: Most offline functions require that the specific program has been previously downloaded to your local device. See Section 3 for details.
2.G Regular Software Releases
QAT receives regular version updates for bug fixes, performance optimization, and new features. When a new version is available, you will be prompted on the login screen to refresh the application.
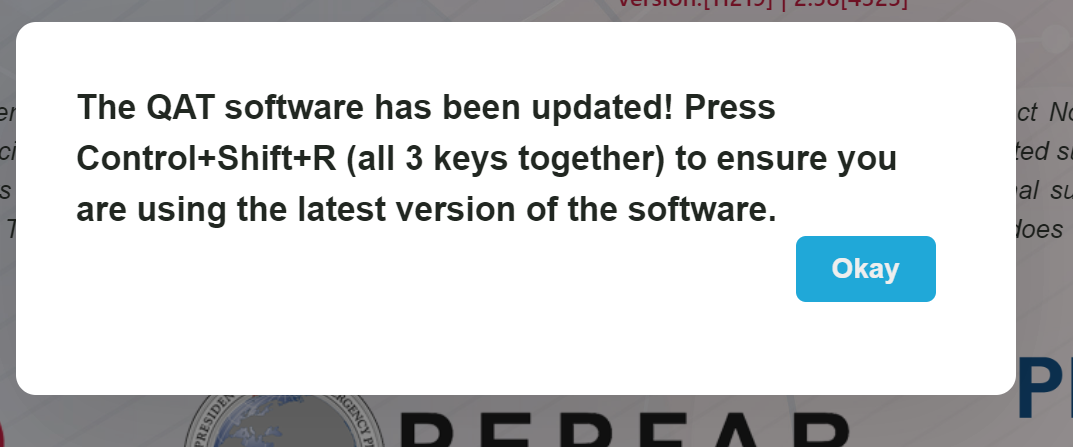 Figure 4: Software Update Notification
[!IMPORTANT] To avoid data loss during major structural updates, ensure all local programs are uploaded to the server prior to the release. The QAT Support Team will notify you in advance if an upload is required.
2.H Solving Common Issues
If you encounter technical difficulties, follow these troubleshooting steps in order:
2.H.1. Application Refresh
Address most minor glitches by performing a hard refresh. Press Ctrl + Shift + R simultaneously. This reloads the software and clears temporary glitches, unlike a standard browser refresh (Ctrl + R).
2.H.2 Full Master Data Sync
If a refresh doesn't work, try a Full Master Data Sync. While a regular MDS only fetches incremental changes, a Full MDS reloads all master data from scratch.
- Location: Click the link at the bottom of the application.
- Requirement: A stable internet connection is required.
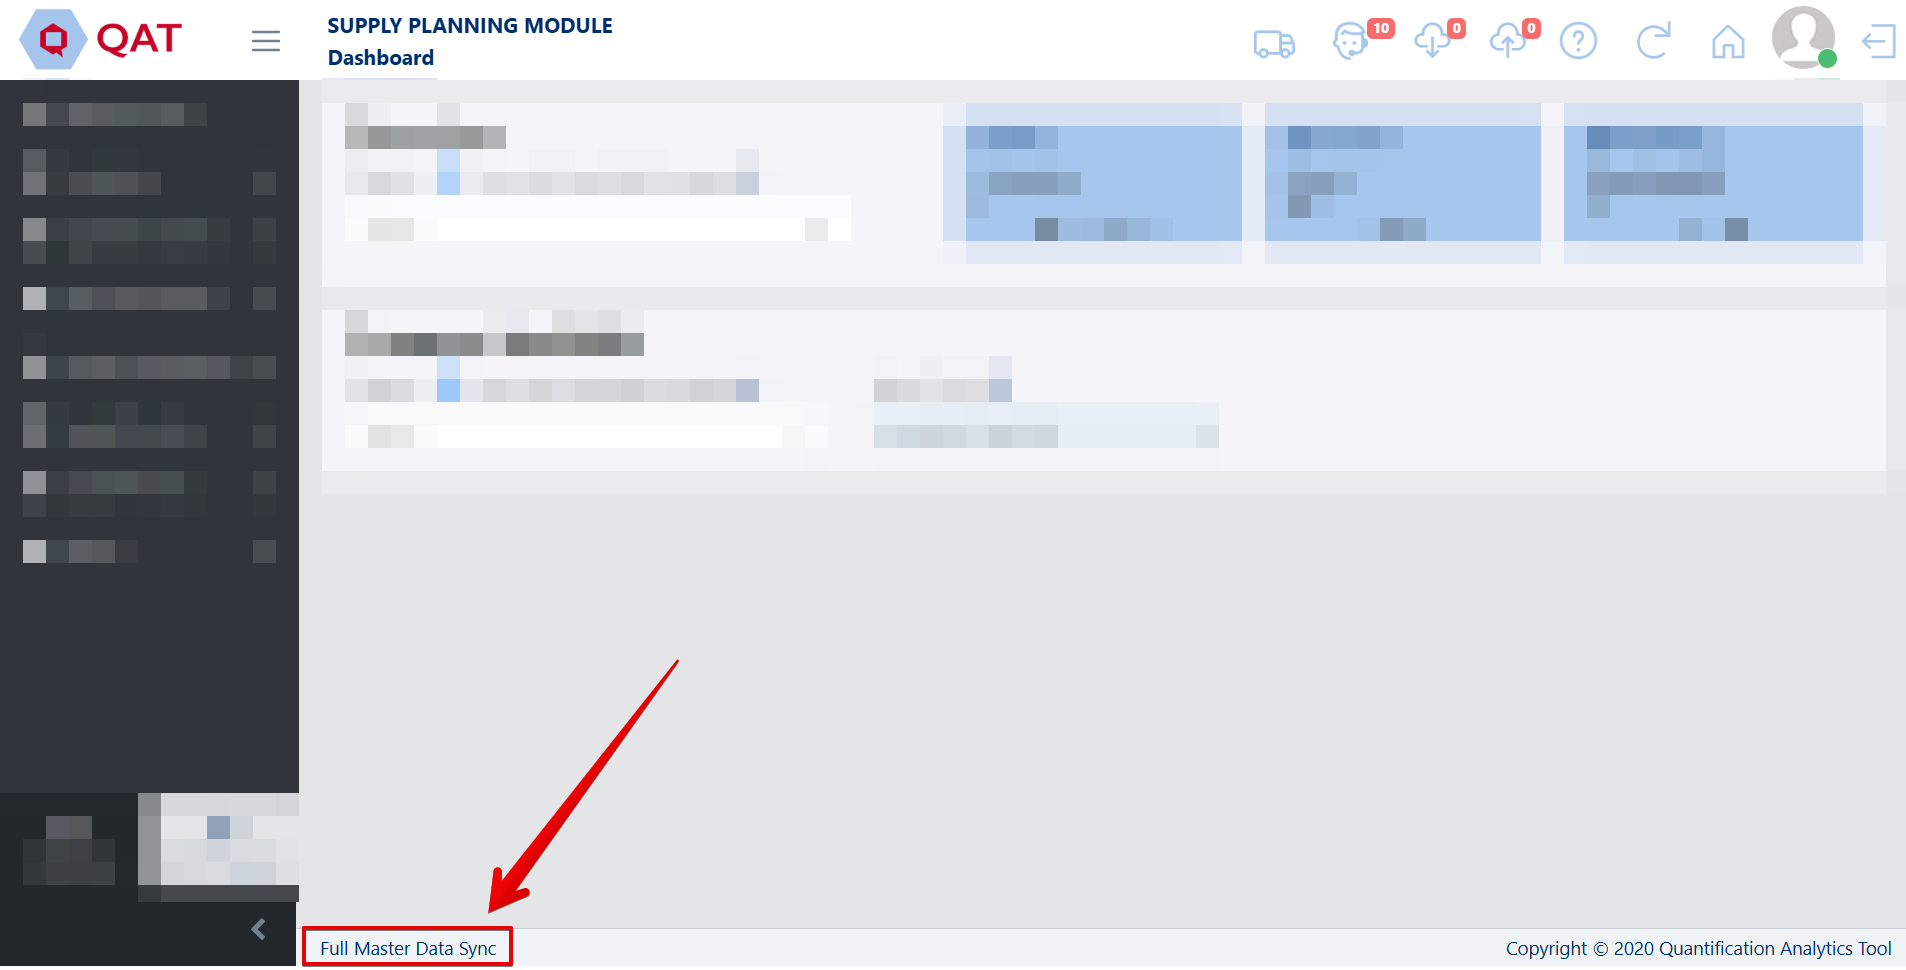 Figure 5: Full Master Data Sync Link
2.H.3 Clear Site Data
As a final troubleshooting step, you can clear all locally stored data.
[!WARNING] This will erase all local changes and downloaded programs. Ensure you have uploaded all data to the server before proceeding.
- Press Ctrl + Shift + I to open the browser's Developer Tools.
- Navigate to the Application tab.
- Select Storage on the left and click Clear site data.
- Log back in and re-download your programs.
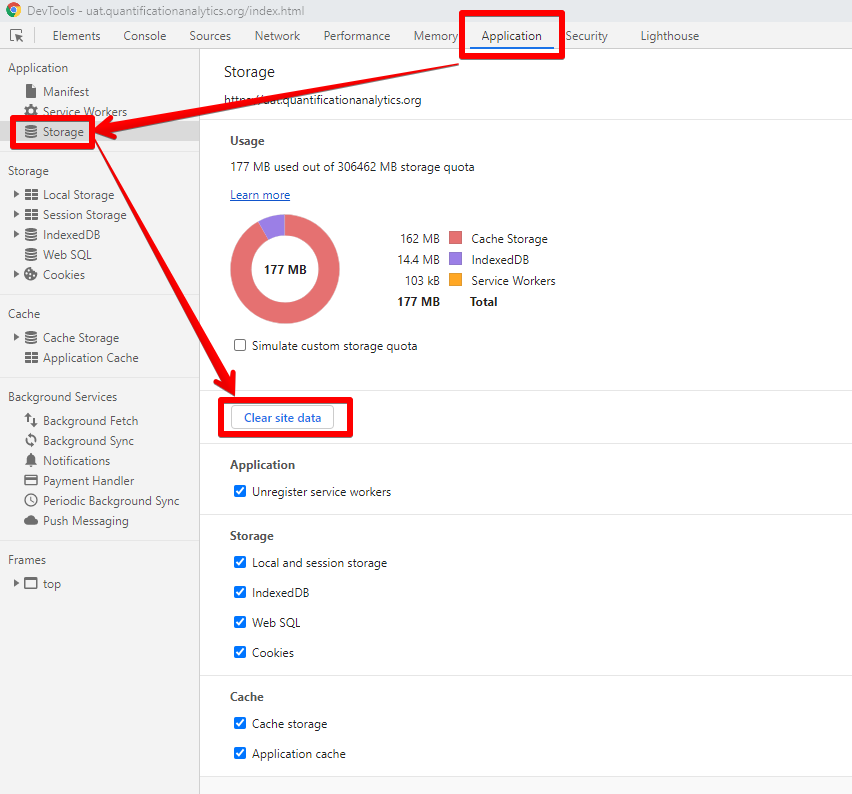 Figure 6: Clearing Site Data
2.H.4 Troubleshooting Network Errors
If you see a "Network error" message, it is usually due to:
- Unstable Internet: Try a faster connection or wait for better signal.
- Firewall Restrictions: Your organization's IT policy may block QAT. Request that your IT department whitelist the following URLs:
api.quantificationanalytics.orgwww.quantificationanalytics.org
2.I QAT Helpdesk and Tickets
The QAT Helpdesk is your primary point of contact for technical support, user management, and feature requests.
2.I.1 Submitting a Ticket
You can access the Helpdesk from the Login Page or the Top Ribbon within the application.
- Click the QAT Helpdesk icon.
- Select one of the following options:
- Add/Update User: Request new accounts or role changes.
- Add/Update Master Data: Request additions to products, procurement agents, etc.
- Request a Change: Propose new features or design improvements.
- Report a Bug: Report technical issues (please include screenshots and steps to reproduce).
- Complete the required fields and click Submit.
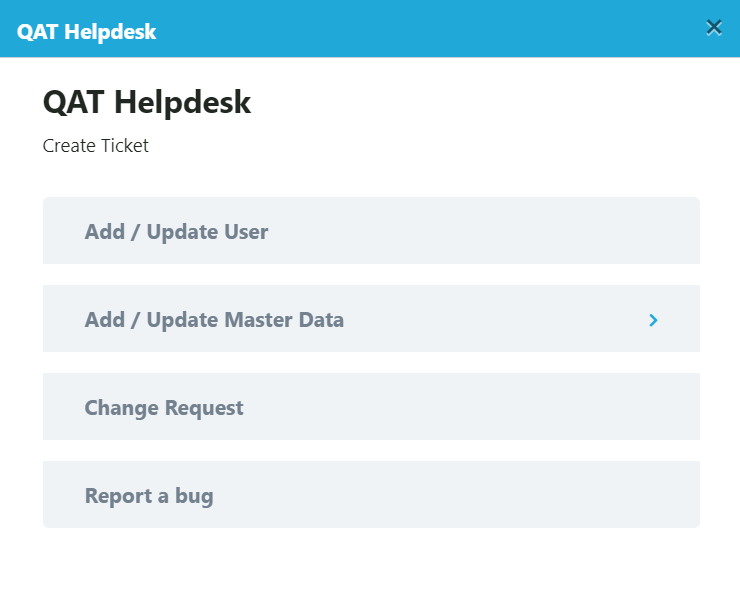 Figure 7: Helpdesk Ticket Options
2.I.2 Reporting a Bug
When a user comes across a potential system issue with QAT, they should attempt to troubleshoot it through an application refresh and/or clearing site data. If neither of these steps resolve the issue, the user should submit a helpdesk ticket to report the bug.
The bug ticket will be addressed by the development team per the business priority, criticality and available ‘capacity’ via the incremental releases. The steps to raise a ticket in QAT is shown below:
-
Open the QAT Helpdesk screen and click on “Report a bug”.
-
Enter a summary of the bug as well as a description of the bug. Please be descriptive and provide as much detail as possible (e.g., what program/version/functionality you were working on, steps you took to obtain the bug, etc).
-
Upload a screenshot of the bug by clicking the “Browse” button and pulling a saved screenshot file from your computer.
-
It is also helpful to provide the program export, if possible (see Program Exports on how to export a local program)
-
*Note: If you want to upload multiple files, place the multiple screenshots in a folder on your computer and zip it before browsing in QAT. Then, upload the zipped folder.*
-
-
Choose a priority (Highest, High, Medium, or Low) for the bug based on the urgency and how it affects daily work in QAT
- Response and resolution times for bugs will be based on priority level
-
Click on the “Submit” button to raise the ticket.
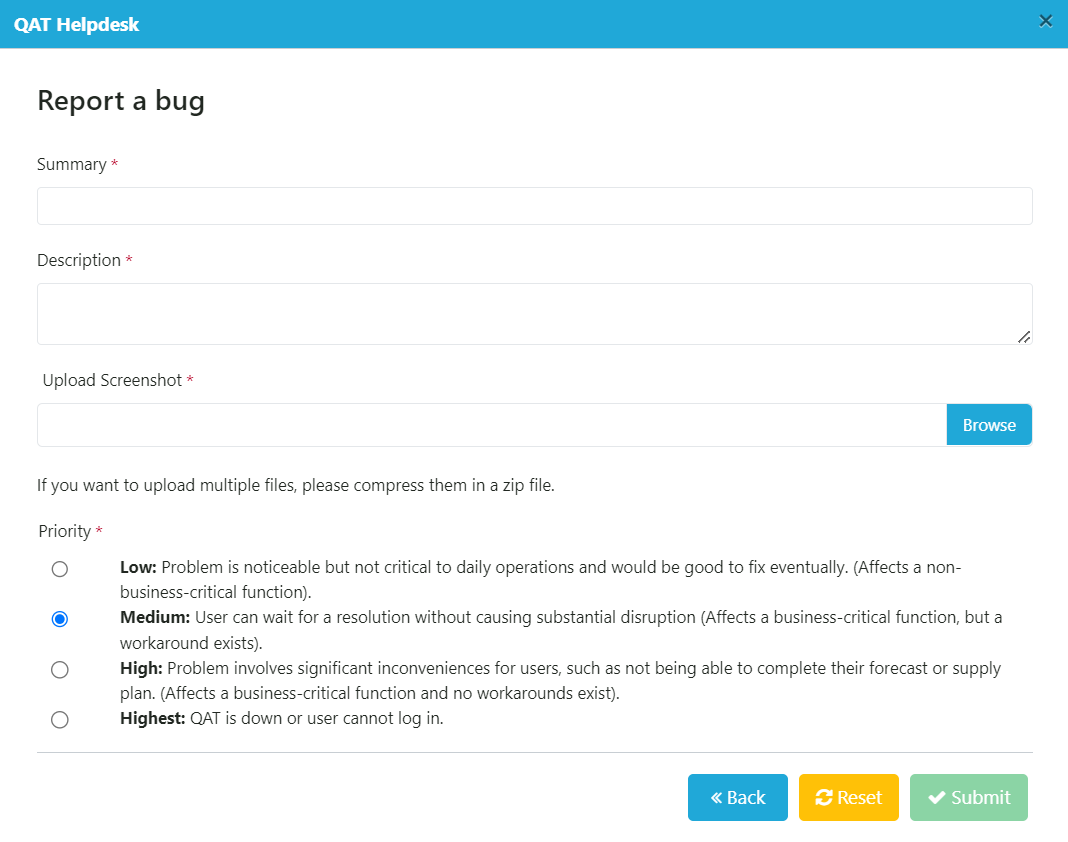
Figure 25: Report a Bug
2.I.3 Tickets for Adding/Updating Users and Master Data
When a user needs to either add or update a user or master data for any reason, they may do so by taking out a helpdesk ticket. Before requesting any additions or changes to the master data in QAT, the user should first check the realm-level master data (Realm Level Masters >> Product) and the Program Catalog Report to make sure the information does not already exist. For more information on how to access and use master data, please see Program Management and Realm Masters. For information on how to access the Program Catalog, please see Program Catalog. To access the QAT Helpdesk:
- > Users can access the QAT Helpdesk from two different locations in QAT:
-
> On the login page, and
-
> from the top right ribbon in QAT
-
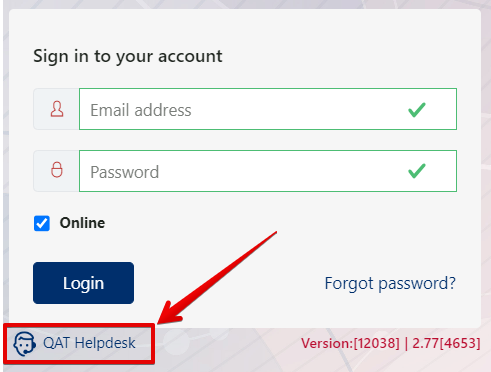

Figure 18: Three location to access the QAT Helpdesk
- > Four options will appear for taking out a ticket: Add/Update User, Add/Update Master Data, Change Request, and Report a Bug. See below sections on Change Requests and Report a Bug.
Figure 19: QAT Helpdesk Menu
-
> Choose to Add/Update User or Add/Update Master data. Either option will take you to different screens for more information.
-
> Enter the information required in the form and click “Submit.”
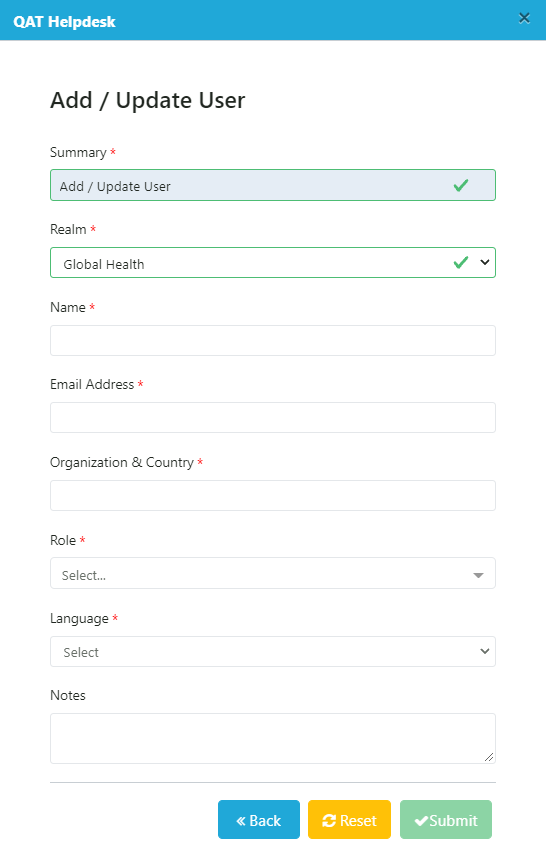
Figure 20: Add/Update User Screen
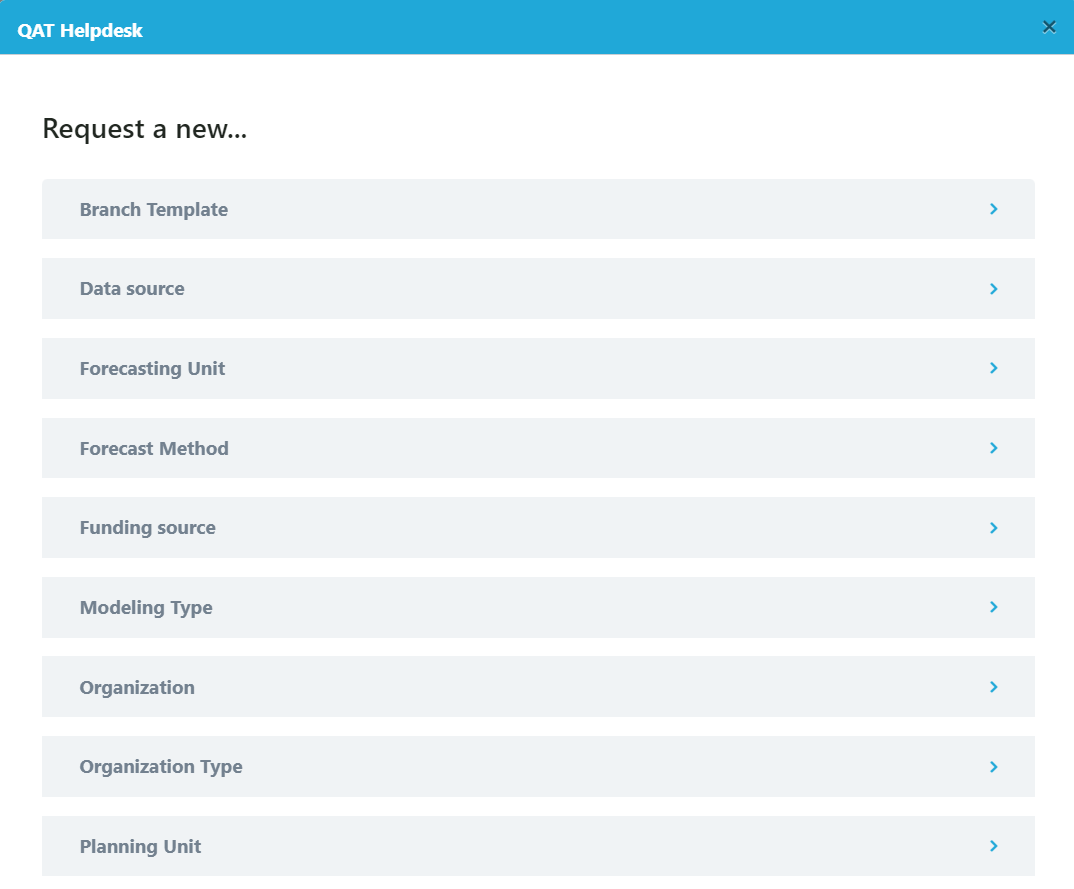
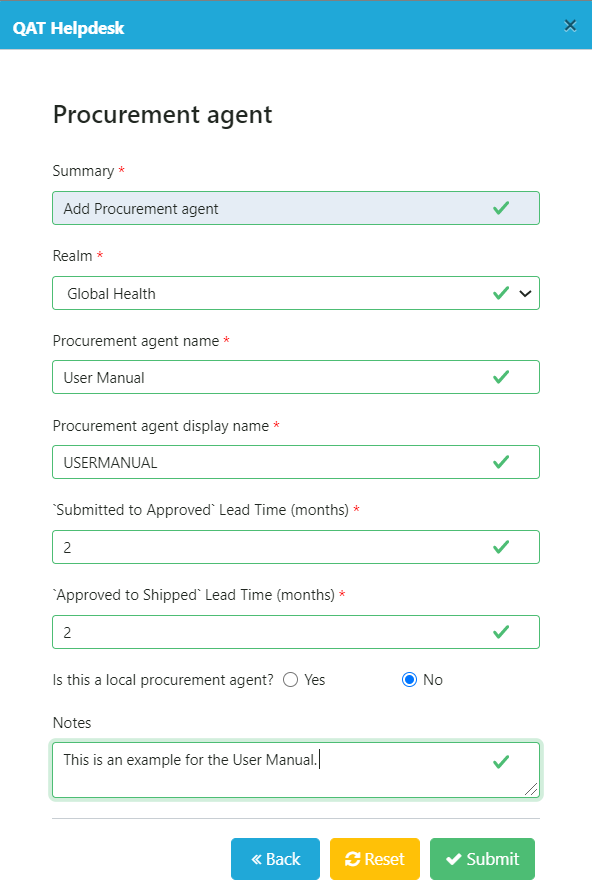
Figure 21: Add Master Data Screen Figure 22: Add Procurement Agent Master Data Screen
After submitting a ticket, the user will be assigned a Ticket Code number (ex: QAT-570). The user will also receive an email notification and the number of “Open Tickets” on the top ribbon in red will increase. This ticket number corresponds to the ticket number stored in the JIRA software management tool. For more information on managing tickets and the JIRA software management tool, please see Managing Tickets.
2.I.4 Requesting a Change
When a user has an idea for a new feature, functionality, or design element that would make QAT a better application for all users, such as a new report, removing an unnecessary column, etc., they may request a change through the QAT Helpdesk. All change request tickets will require a detailed description and screenshots. Once the technical team receives a user’s change request ticket, it will be reviewed for feasibility and usefulness to all QAT users. If the change request is accepted, it will not be made available in QAT immediately, but will placed in a queue based on realm business priority, criticality, and LOE requirements. To request a change in QAT:
- > Click on the QAT Helpdesk icon.
Figure 23: QAT Helpdesk Icon
-
> Click on “Request a Change” from the QAT Helpdesk menu options.
-
> Complete the form by filling out the required information and click “Submit,”
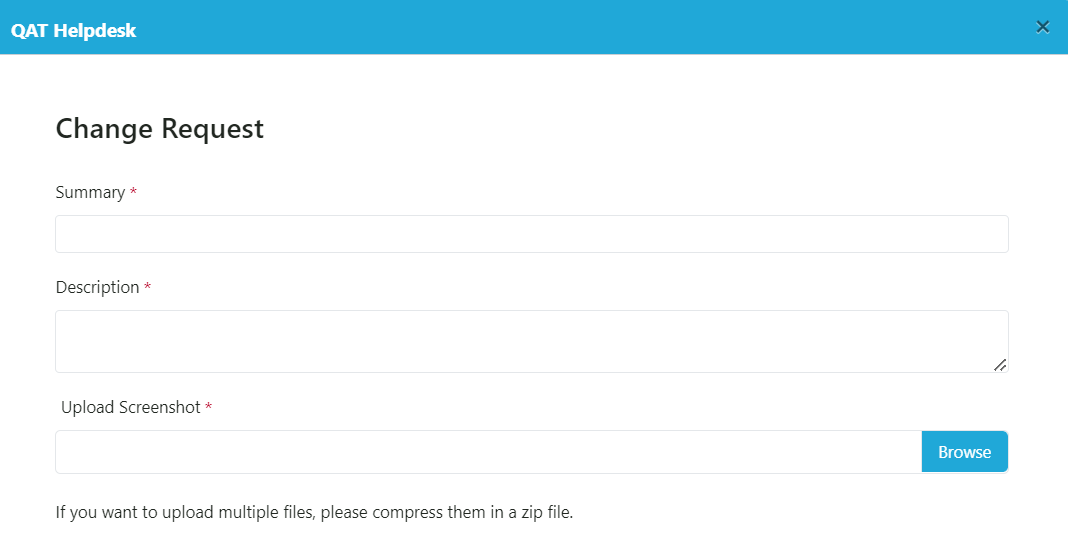
Figure 24: Change Request Ticket
- > After submitting a ticket, the user will be assigned a Ticket Code number (ex: QAT-570). The user will also receive an email notification and the number of “Open Tickets” on the top ribbon in red will increase. This ticket number corresponds to the ticket number stored in the JIRA software management tool. For more information on managing tickets and the JIRA software management tool, please see Managing Tickets.
2.I.5 Managing Tickets
After submission, you will receive a Ticket Code (e.g., QAT-570) and an email notification.
- Tracking: Click View Requests in the notification email to check status or add comments.
- JIRA Integration: QAT uses JIRA for ticket management. While optional, you can create a JIRA account to track all your requests in one place.
For enhanced visibility, QAT will give users the option to manage and check the status of their tickets, whether they are adding/editing a user or master data, requesting a change, or reporting a bug. When a user submits a ticket, they will be assigned a Ticket Code number (ex: QAT-570). The user will also receive an email notification and the number of “Open Tickets” on the top ribbon in red will increase. This ticket number corresponds to the ticket number stored in the JIRA software management tool.

Figure 26: Helpdesk Ticket Code Number Figure 27: Number of Tickets on Top Ribbon
From the email notification, users may click on “View Requests” to see the status of their ticket. Users may also add additional comments and screenshots to their request, if desired. Users will always receive an email notification once the ticket has been completed.
Note: In order to fully access the ticket via the JIRA software management tool, users must create an account with a username and password in JIRA. Creating an account in JIRA is optional. JIRA is an outside software management tool that can be accessed through the link provided in the email, by clicking on the HelpDesk icon and then choosing “Manage my tickets” in the top right corner of the pop-up, or directly through https://qathelpdesk.atlassian.net/servicedesk/customer/portals.
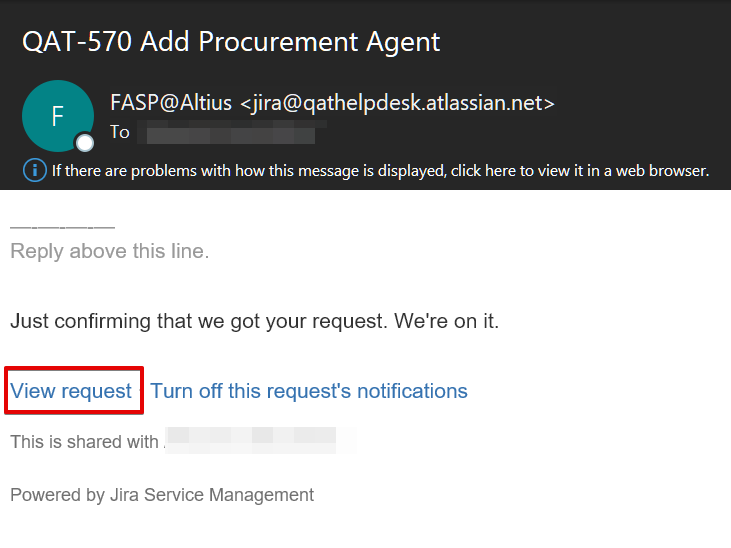
Figure 28: Email Notification for QAT Ticket
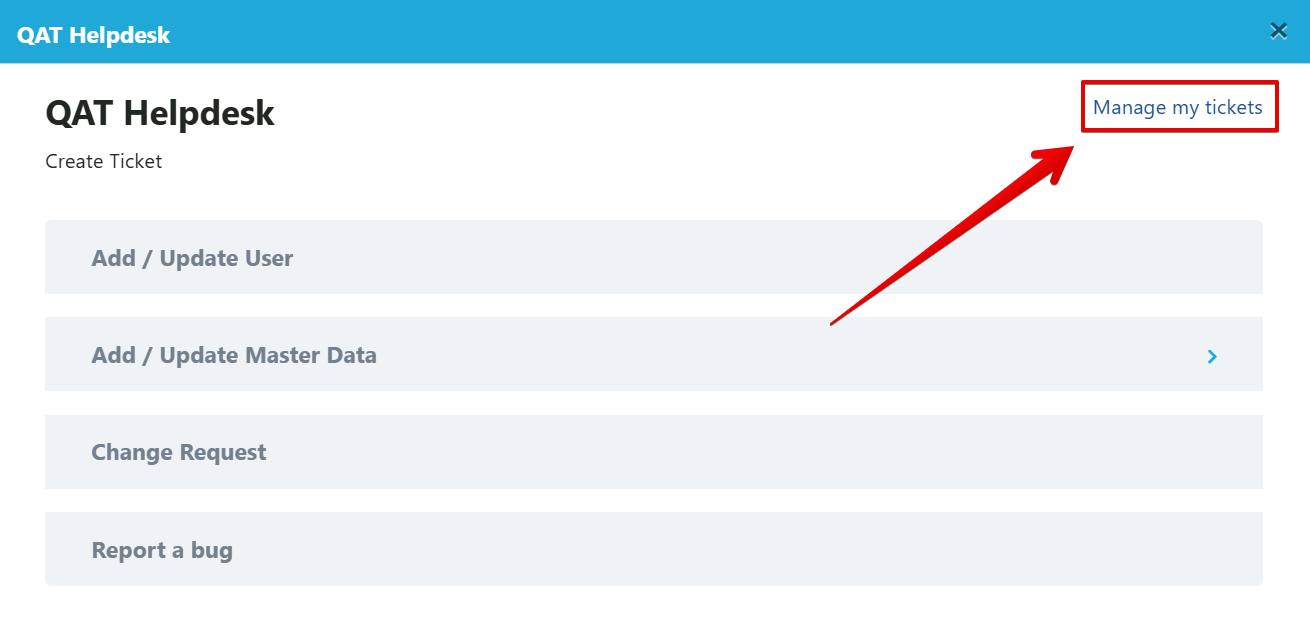
Figure 29: Option to Navigate to JIRA
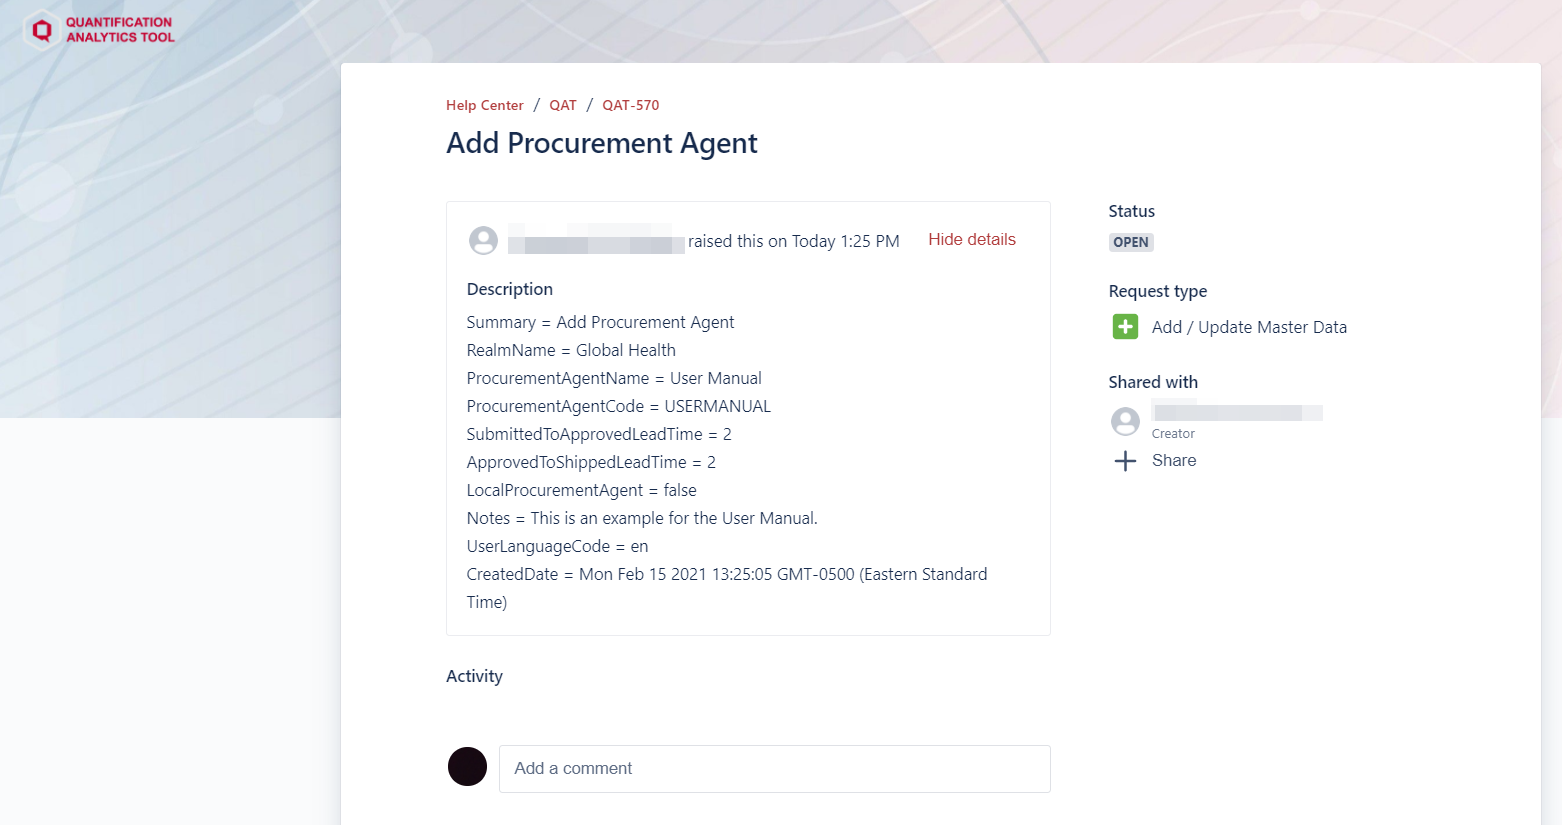
Figure 30: JIRA Ticket Management
2.J Navigation and Menu Bar
2.J.1 Homepage and Dashboard
Upon logging in, you will see the main Dashboard.
- Supply Planning Module: Features enhanced visualizations and analytics.
- Forecasting Module: Displays tiles for each downloaded program. Click a tile's arrow to manage versions, trees, or data entry.
To return to the Dashboard at any time, click the Home icon in the top ribbon or the QAT Logo in the top-left corner.
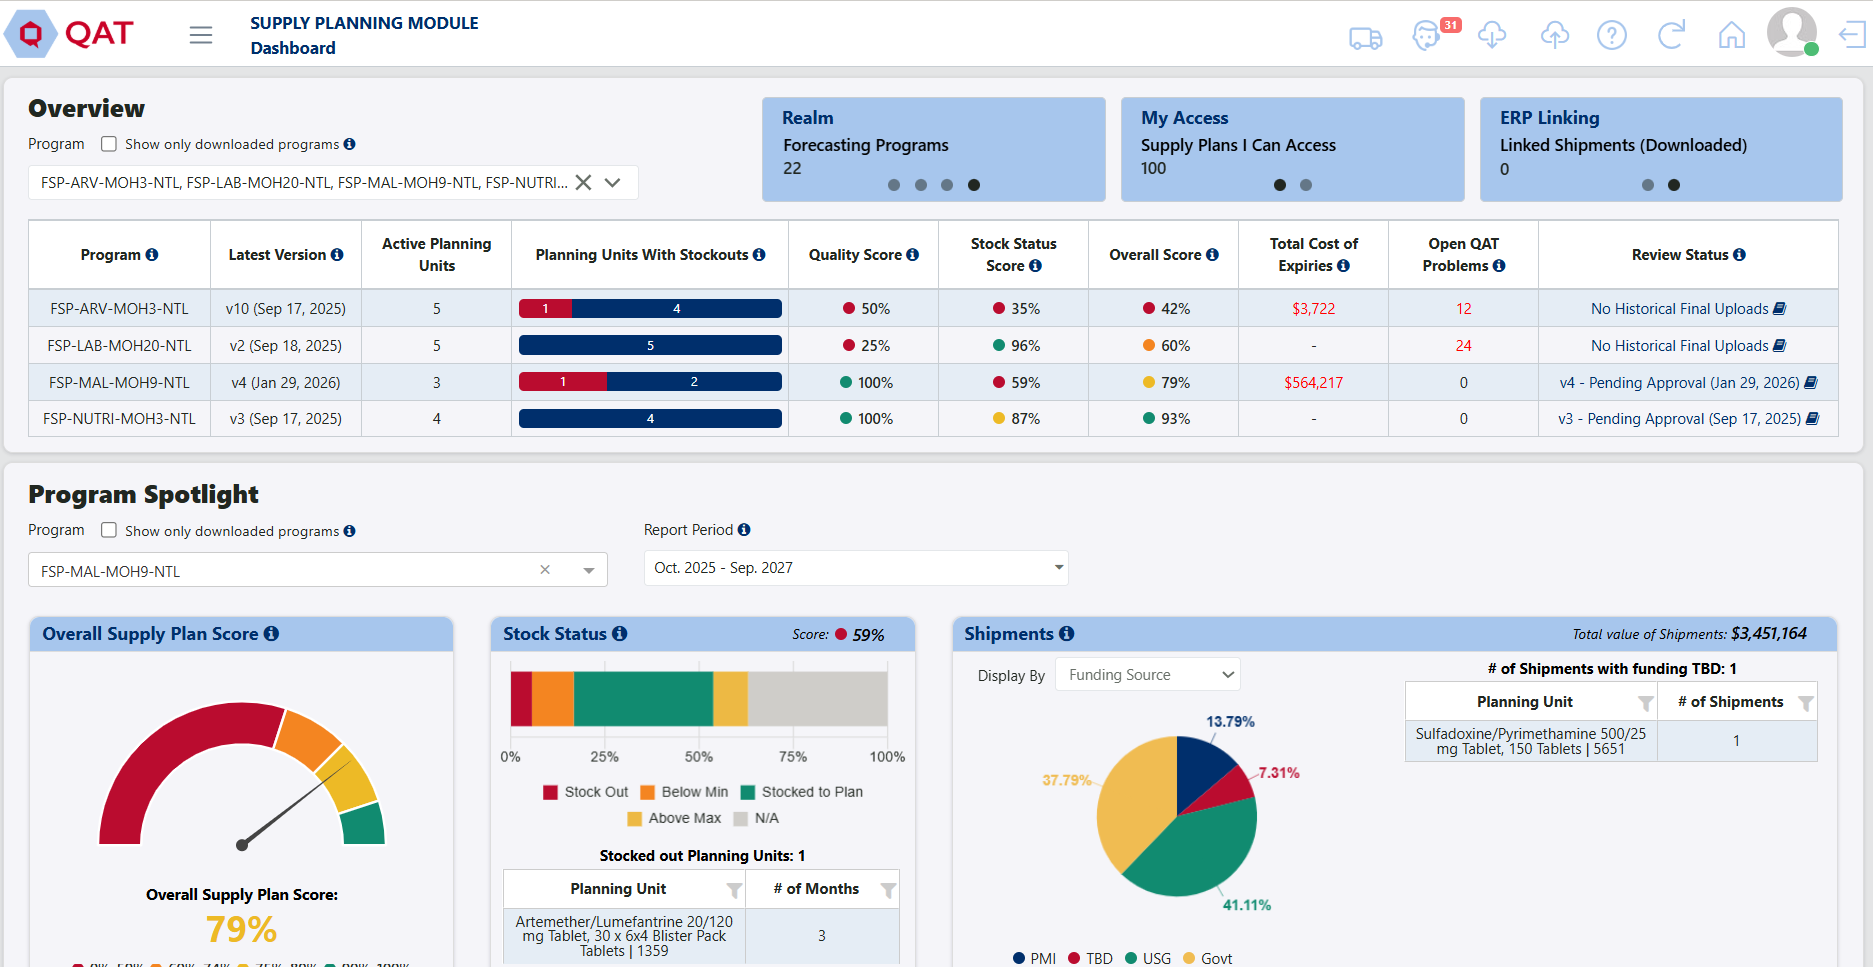 Figure 8: Supply Planning Home Screen
2.J.2 Interface Layout
The interface consists of three primary areas:
- Top Ribbon: Quick access to global functions (Profile, Helpdesk, Sync).
- Sidebar Menu: Navigation to module-specific screens (Master Data, Reports, etc.).
- Main Content Area: Where data entry and analysis occur.
Top Ribbon for Supply Planning vs. Forecasting:


2.J.3 Top Ribbon Functions
| Icon | Function |
|---|---|
 | Logout: Logs you out of the QAT application. |
 | User Profile: Green when online, red when offline. Click to view username/roles, change language, reset password, or toggle online/offline mode. |
 | Dashboard: Returns you to the main home screen. |
 | User Manual: Downloads the QAT manual to your local device. |
 | Refresh Page: Reloads the current screen. |
 | Upload Status: Blue indicates no changes pending. Red indicates local changes are ready for upload; the number shows affected programs. |
 | Version Sync: Red indicates a newer version is available on the server; click to synchronize your local program. |
 | QAT Helpdesk: Opens the ticketing portal for support, data updates, or bug reports. The number tracks your open tickets. |
 | ERP Updates: (Supply Planning only) Alerts you to updates from linked ERP systems (e.g., ARTMIS). |
 | Workflow Guidance: (Forecasting only) Displays a high-level guide to the forecasting process. |
Additionally, users can utilize the profile icon to check their current user roles, as well as:
-
Change their password,
-
Chage to dark/light theme mode, and

-
Show decimals in the supply planning screens


2.J.3 Sidebar Menu
The sidebar menu allows you to navigate through QAT's various screens. Available options depend on your assigned role and permissions.
Key Modules
- Supply Planning Module: Manage supply plan data, conduct reviews, and view supply planning reports.
- Forecasting Module: Build forecast trees, import consumption data, and analyze forecast outputs.
- Master Data Sync: Manually synchronize updated master data without logging out.
- Application & Realm Masters: (Admins only) Manage high-level data structures and realm-specific settings.
Sidebar Navigation Icons
| Icon | Action |
|---|---|
| Full Collapse: Hides the sidebar menu entirely for more screen space. | |
 | Minimize: Reduces the sidebar to icons only. |
 | Expand: Restores the full sidebar or expands a sub-menu. |
 | Collapse Sub-menu: Hides nested menu items. |
 | Module Toggle: Switches between the Forecasting and Supply Planning modules. |
Table 4: Sidebar Menu Icons
2.J.4 Common Action Buttons
| Button | Action |
|---|---|
 | Submit: Saves changes and updates the database. |
 | Cancel: Discards unsubmitted changes. |
 | Revert: Returns unsubmitted data to its previous state. |
 | Add: Creates a new record. |
 | Update: Modifies an existing record. |
 | Search: Filters the current table for specific keywords. |
 | Clear: Resets all active filters and search fields. |
| Required Field: Indicates that data entry is mandatory. | |
| Tooltips: Displays definitions, formulas, or context for specific terms. | |
| Page Guidance: Provides high-level instructions for the current screen. | |
 | Export: Downloads data/reports as PDF, CSV, or Word files. |
2.K Changing Language
To ensure that QAT is adaptable to users around the world, the application displays text in four different languages: English, French, Portuguese, and Spanish. Users are encouraged to submit tickets if they would like to see a particular label translation improved. (Note: Translations for application labels can be edited only by application admins. Instructions on how to do so can be found in the translation section.)
There are two ways to change the language displayed for the user:
- Login Screen:
On the top right corner of the login screen, there is a drop-down menu from which users can select their preferred language ahead of logging in. This will not only change the text once you are logged in to QAT but it will also change the text displayed on the login screen.
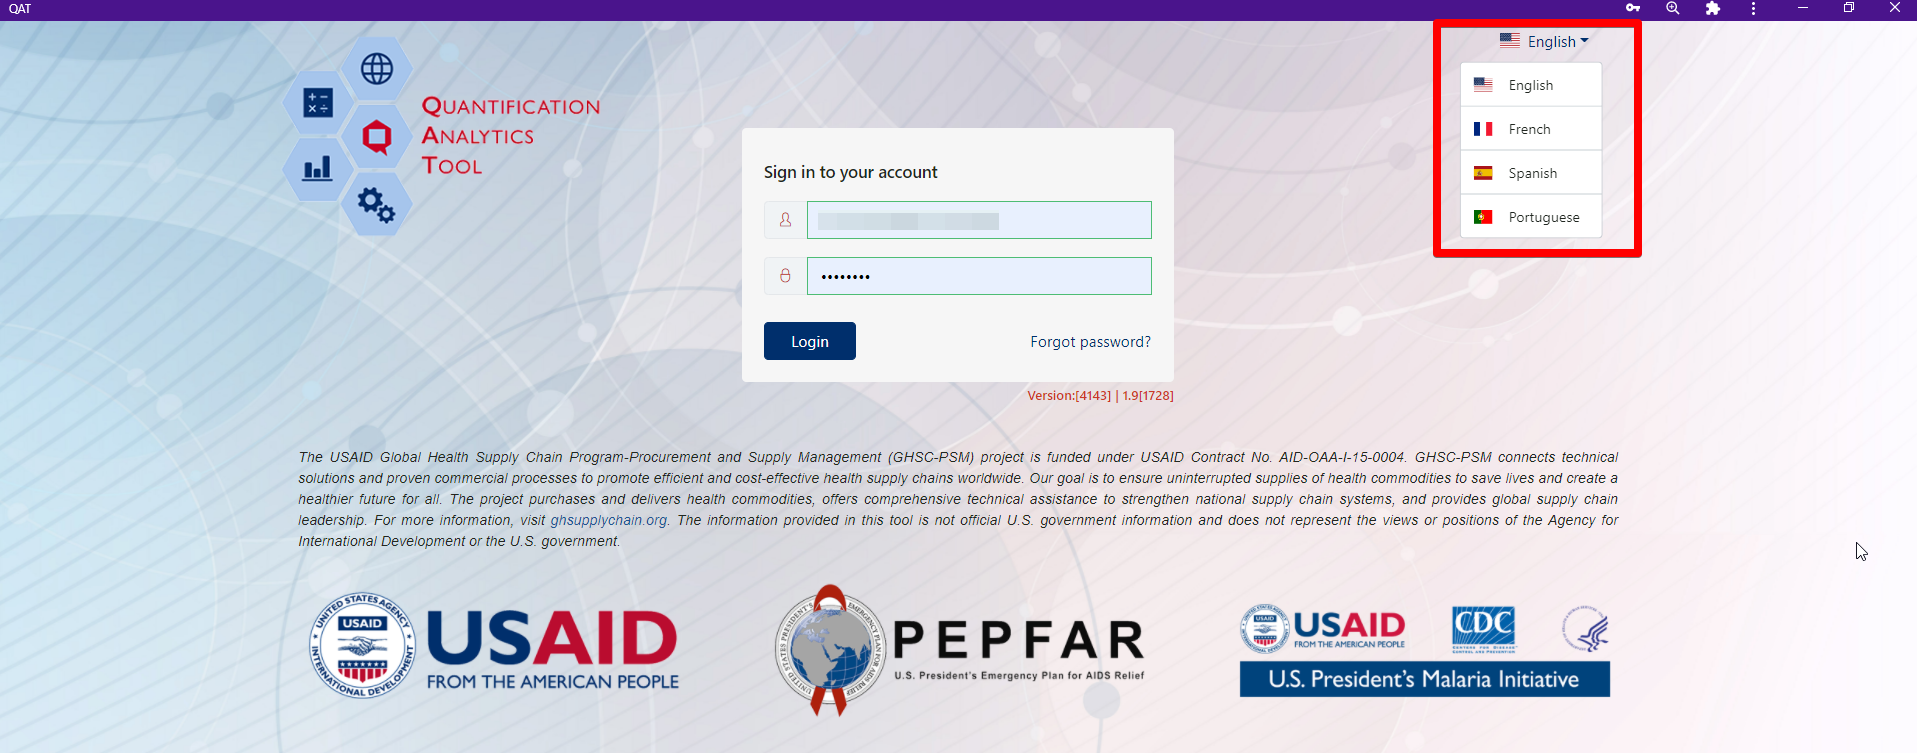
Figure 34: Login Screen Language Change
- Within QAT:
Once logged into QAT, the user may change the display language by clicking on the user profile icon on the top right corner of the screen, selecting the preferred language and then the tool will automatically update it’s text/labels.
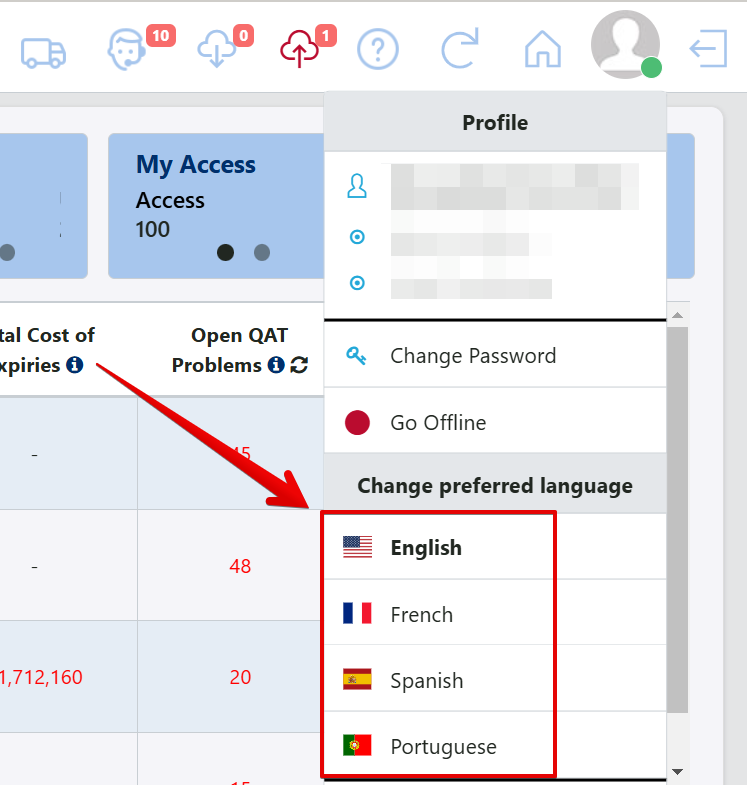
Figure 35: In Tool Language Change
2.L QAT Dashboard
The Supply Planning dashboard provides a comprehensive interface for visual analytics. It is divided into three main sections: Ticker, Overview, and Program Spotlight.
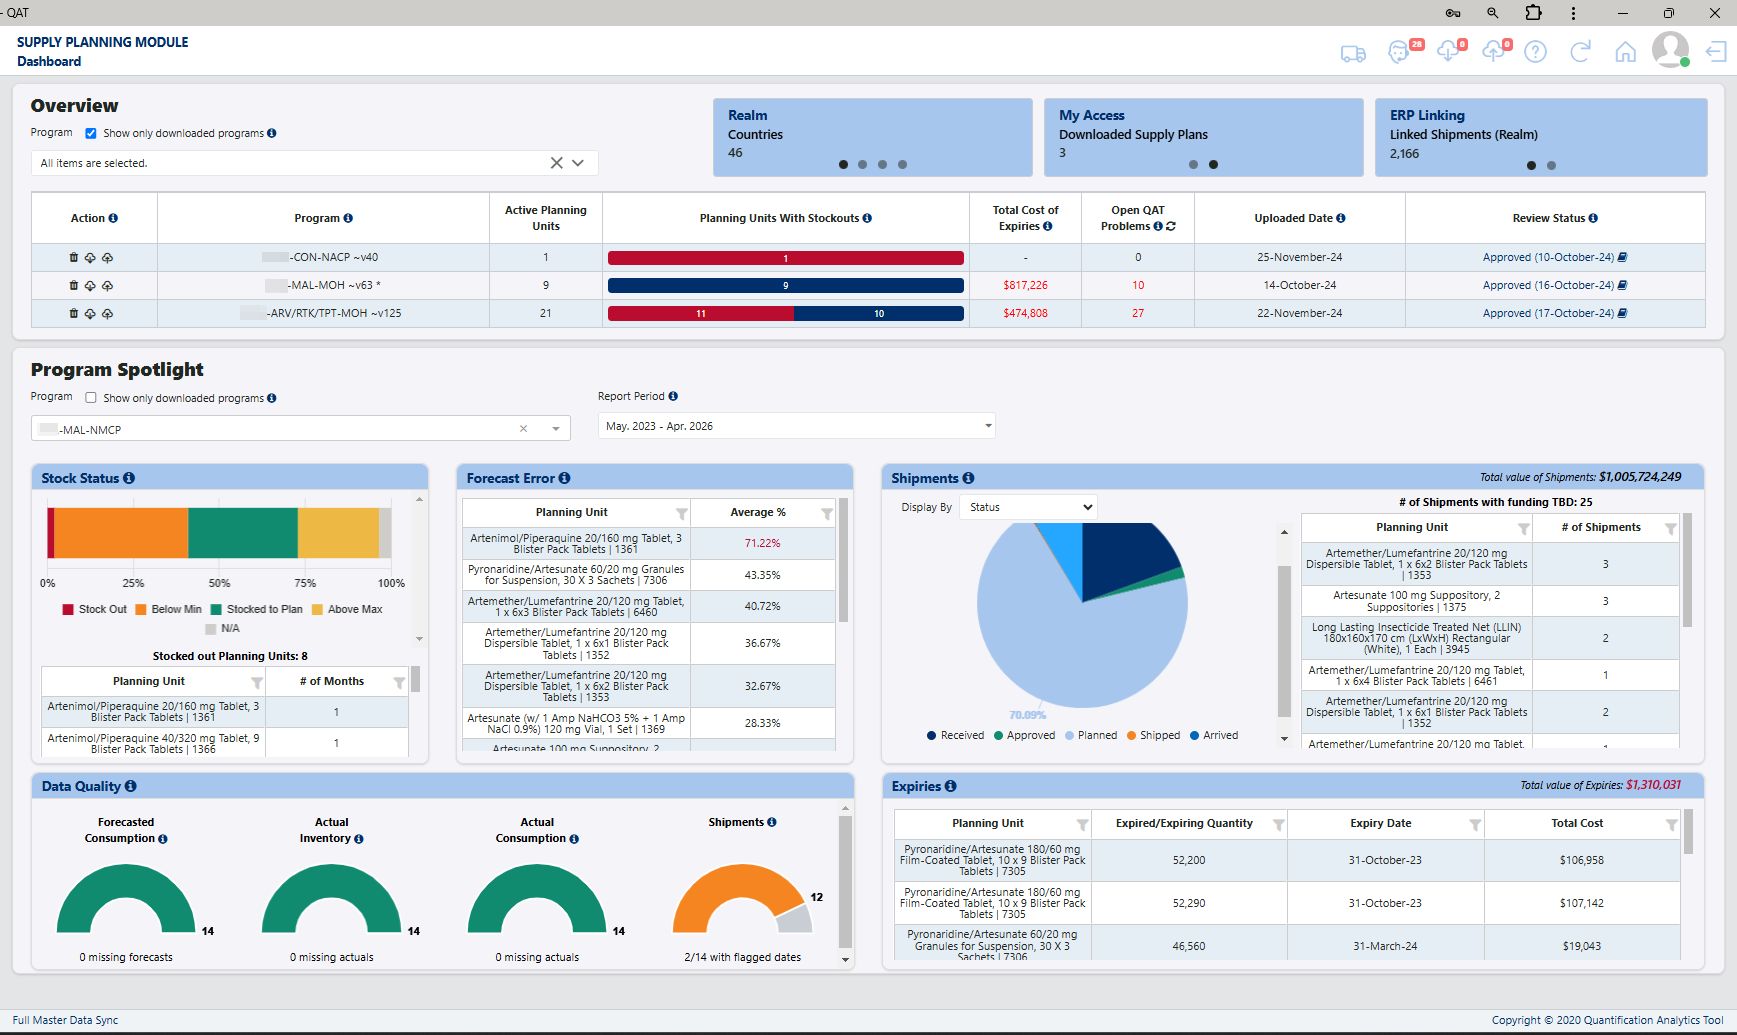
Figure 36: QAT Supply Planning Dashboard
2.L.1. Ticker
The Ticker displays high-level metrics via three auto-scrolling tiles:
- Realm: Shows global counts of countries, users, and programs.
- My Access: Lists supply plans available to you.
- ERP Linking: Shows the count of linked shipments across your programs.
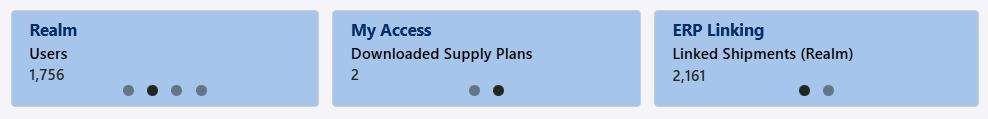
Figure 37: Dashboard Ticker Tiles
2.L.2. Overview
The Overview table summarizes multiple programs based on your access level.
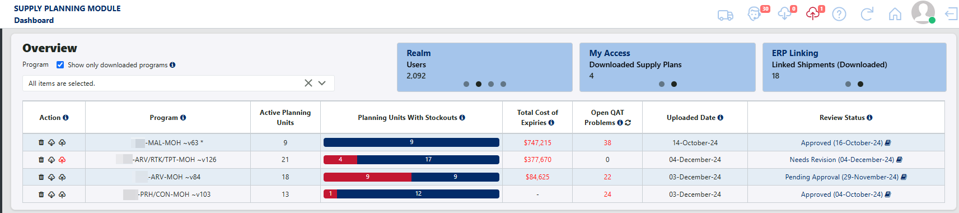
Figure 38: Dashboard Overview Table
- Program Selection: Choose between server-based or local (downloaded) programs. Multi-select is supported.
- Action Column: (Local programs only) Provides quick links for deleting, uploading, or downloading programs.
- Problem List (QPL): (Local programs only) Click the number in this column to jump to the QAT Problem List for that program.
- Notes & Status: Review the current status and historical notes for each supply plan.
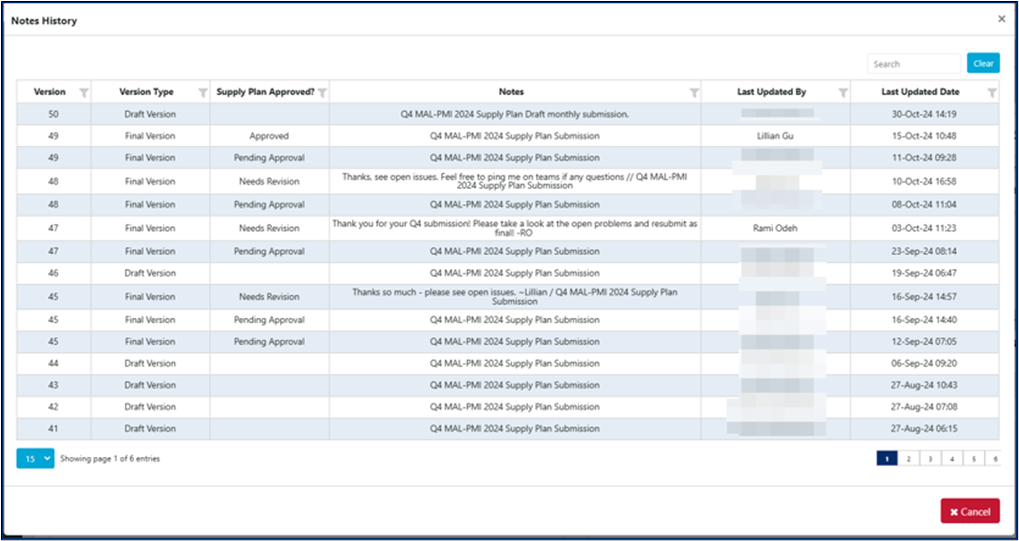
Figure 39: Program Version Notes
2.L.3. Program Spotlight
This section provides deep-dive metrics for a single selected program.
- Stock Status: A bar graph showing the percentage of months by stock category (e.g., Stocked, Overstocked, Stockout).
- Forecast Error: (Server programs only) Highlights planning units with high error rates (default >50%).
- Shipments: A pie chart showing funding sources and procurement status for upcoming shipments.
- Data Quality: Displays real-time metrics from the QAT Problem List (QPL), such as missing consumption data or overdue shipments.
- Expiries: Summarizes the quantity and total cost of products expiring within the report period.
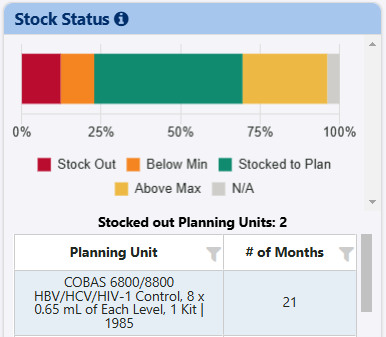
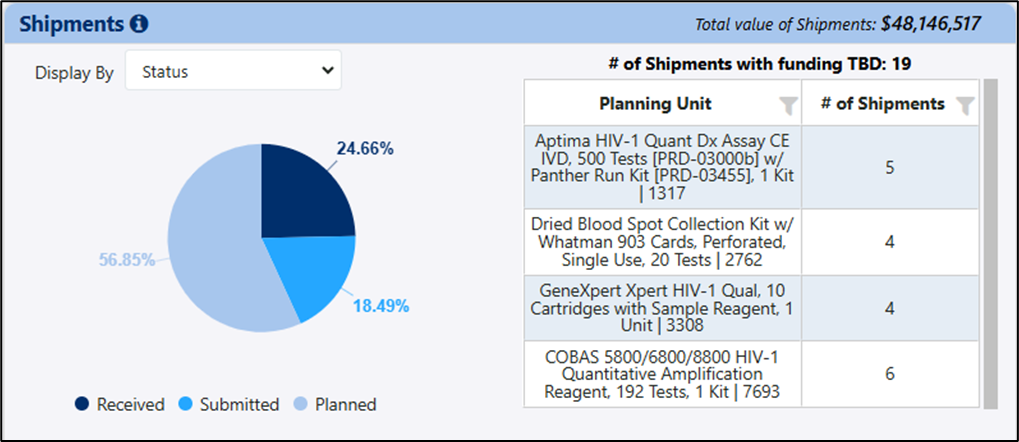
Figure 40: Stock Status & Figure 41: Shipment Analytics
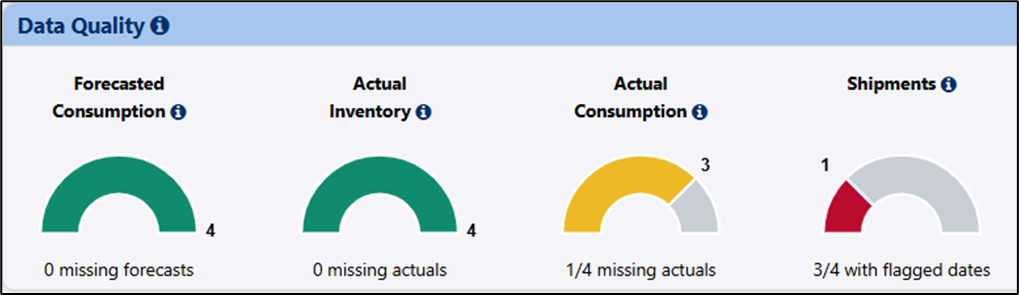
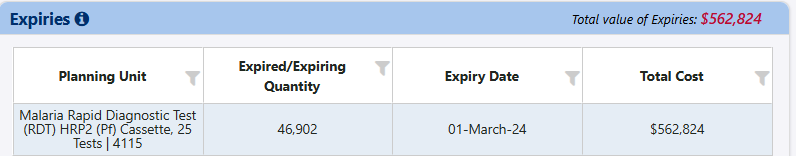
Figure 42: Data Quality & Figure 43: Product Expiries